Fig. 5
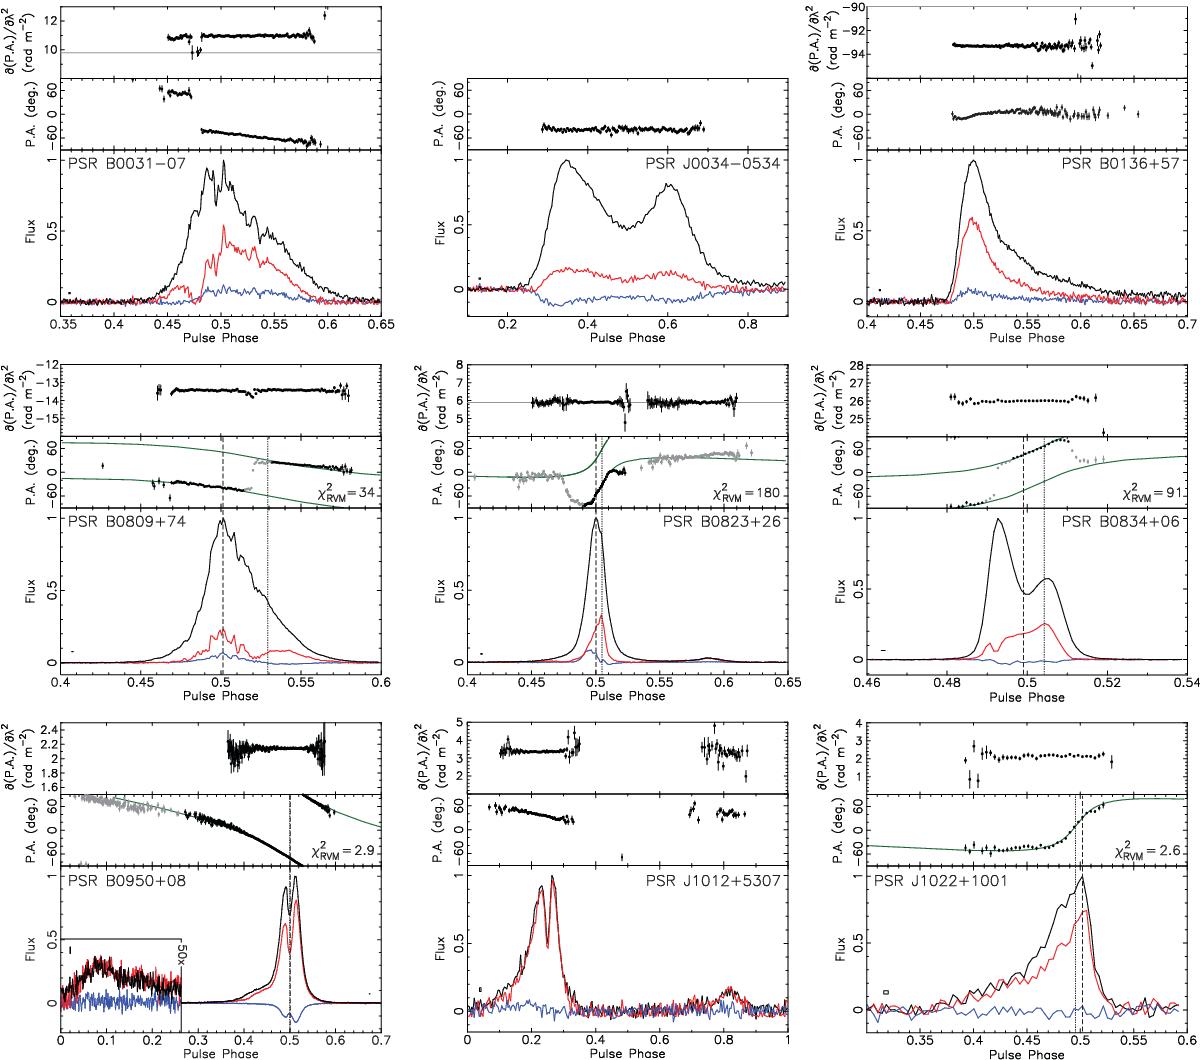
Polarisation profiles of 20 pulsars observed with the LOFAR core at ~ 150 MHz. In each profile, the flux density of the total (black lines), linearly polarised (red lines) and circularly polarised emission (blue lines) is shown in arbitrary units normalised to unity. Above each flux profile, the profile of the polarisation angle (PA) of the linearly polarised emission is shown. Only PA values corresponding to phase bins having an S/N in linear polarisation of (S/N)L> 3 are shown. Above the PA profiles, we show the values of the first derivative of the PA with respect to λ2, calculated within our band, at the phases of the PAs with (S/N)L> 5 (see Sect. 6). As a reference, the published value of RM is indicated with a dashed, grey line, when it resides inside the plotted range. For PSRs J0034−0534 and B2111+46, we have not detected linear polarisation of astrophysical origin (see Sect. 8.3.1). For 15 pulsars, the phase of the emission assumed to be generated nearest to the magnetic pole is shown with a vertical, dashed line. The phase at the steepest PA gradient is shown with a vertical, dotted line, determined from RVM fits to the PAs (green lines). For some pulsars, the PA values shown in grey were zero-weighted to improve the RVM fit (see Sect. 7 for details). The reduced ![]() of each RVM fit is shown for each profile. The temporal resolution and the off-pulse rms of each profile are shown near the bottom, left corner of the pulse profiles, with a square of corresponding dimensions. Finally, the weak interpulse of PSR B0950+08 is shown in the inset box, magnified 50 ×.
of each RVM fit is shown for each profile. The temporal resolution and the off-pulse rms of each profile are shown near the bottom, left corner of the pulse profiles, with a square of corresponding dimensions. Finally, the weak interpulse of PSR B0950+08 is shown in the inset box, magnified 50 ×.
Current usage metrics show cumulative count of Article Views (full-text article views including HTML views, PDF and ePub downloads, according to the available data) and Abstracts Views on Vision4Press platform.
Data correspond to usage on the plateform after 2015. The current usage metrics is available 48-96 hours after online publication and is updated daily on week days.
Initial download of the metrics may take a while.