Fig. 4
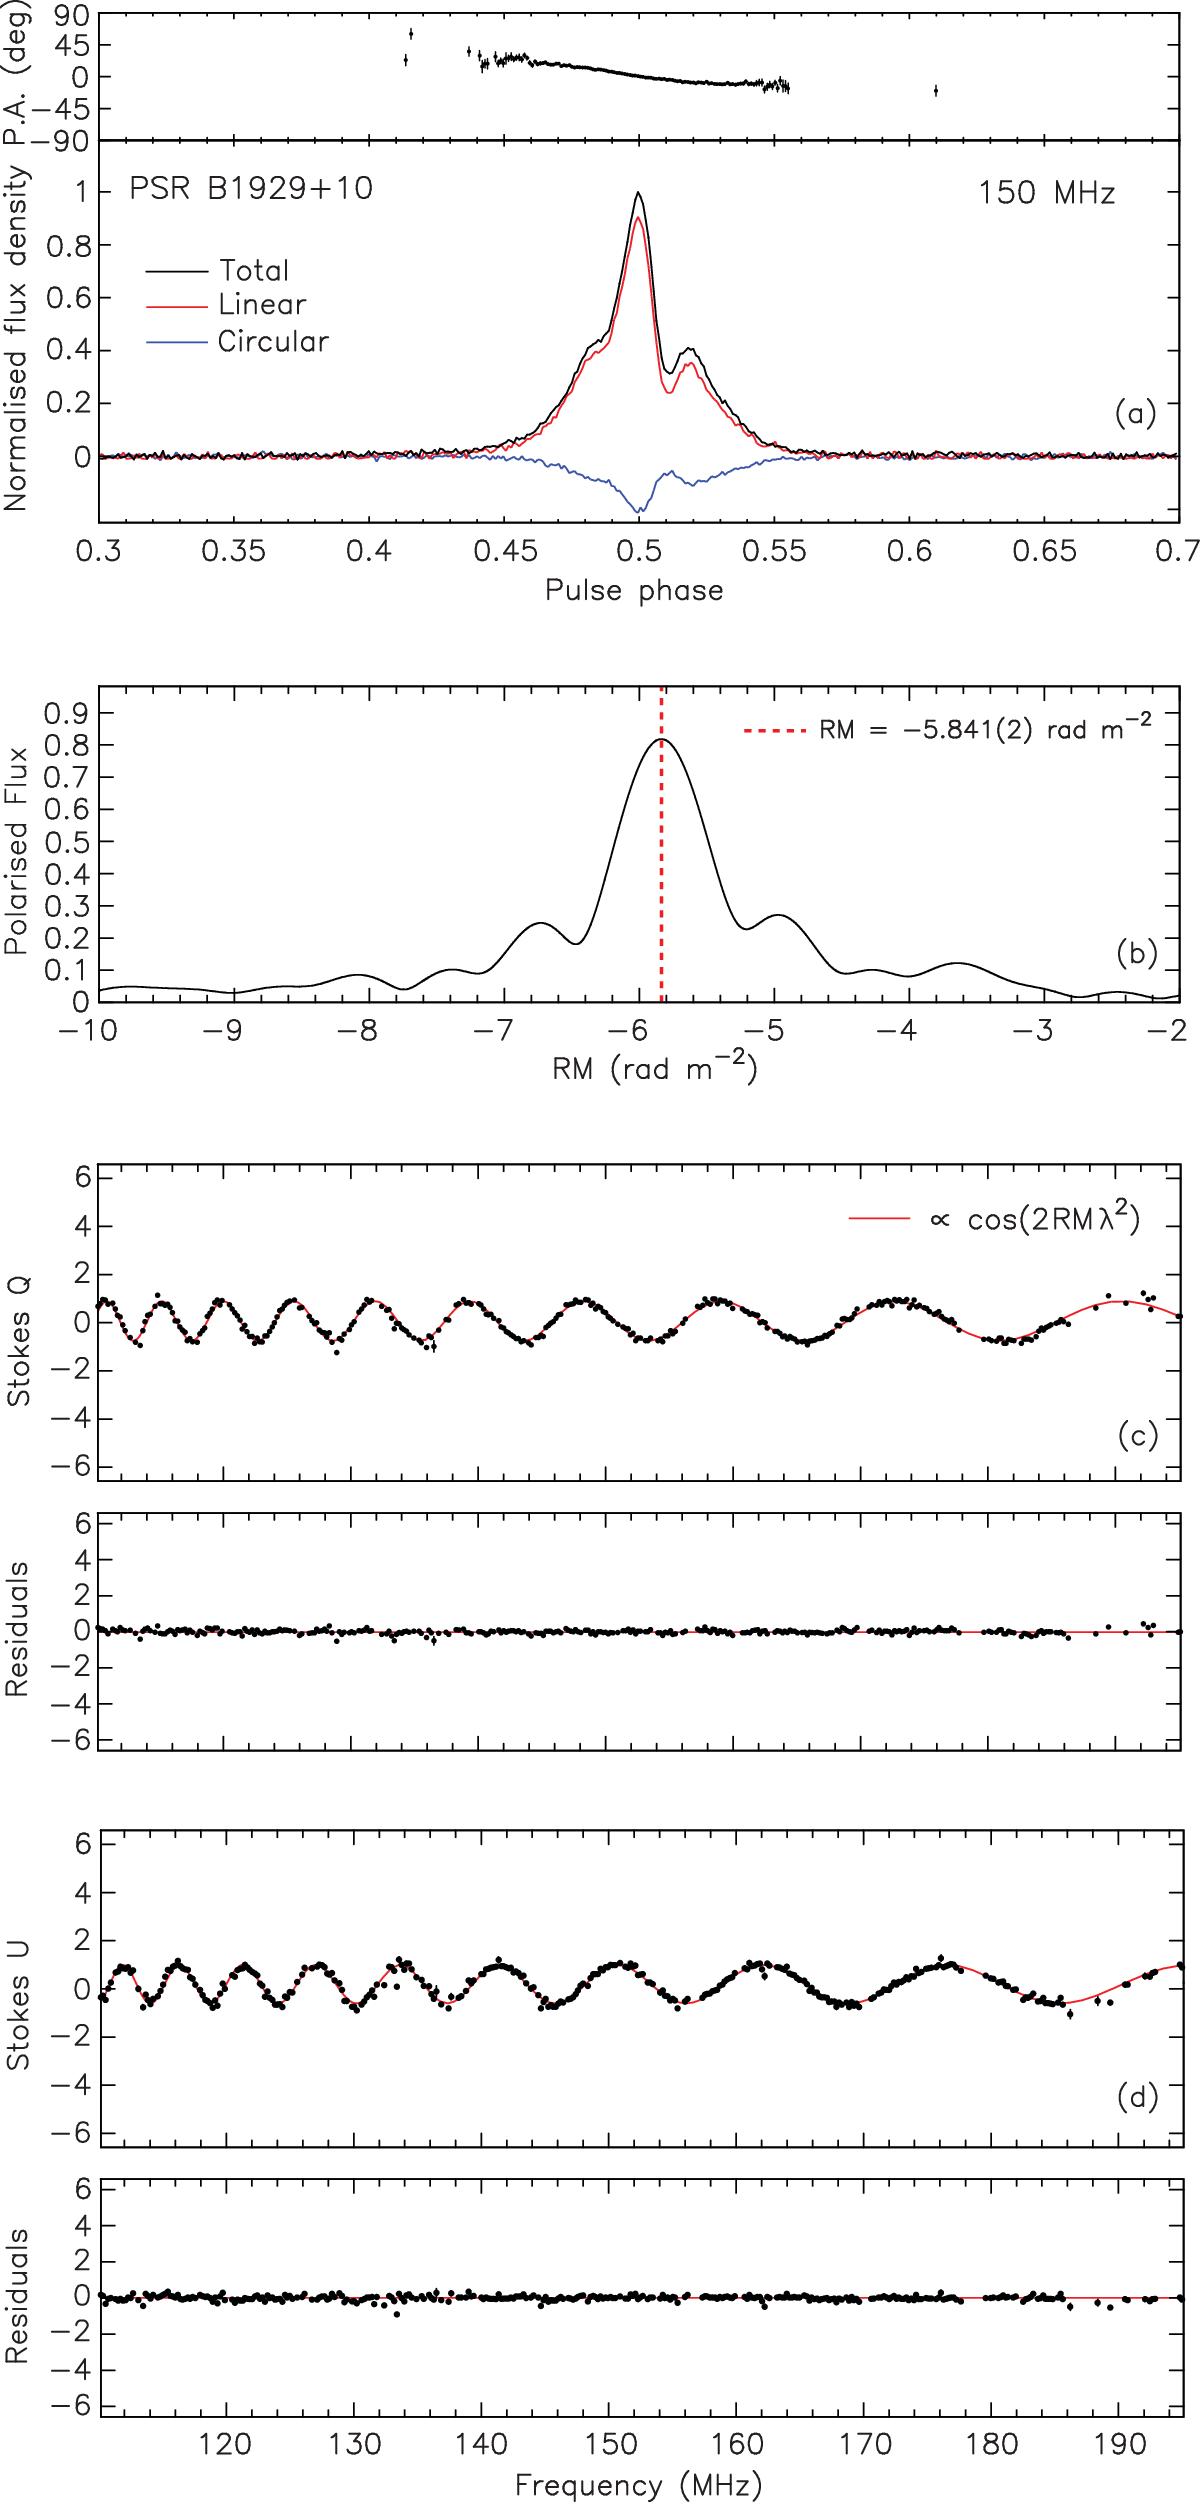
a) Average polarisation profile of PSR B1929+10 at 150 MHz. The black line shows the total intensity, the red line shows the linearly polarised intensity and the blue line, the circularly polarised intensity. The top panel shows the profile of the polarisation angle. b) RM spectrum of PSR B1929+10, derived from the application of the RM synthesis method to the polarisation data taken at 150 MHz. The maximum peak in the spectrum, indicated with a dashed red line, corresponds to the RM of the pulsar, RM = −5.837(2) rad m-2, where the number in parentheses shows the uncertainty on the last significant digit. c), d) Variation of the Stokes Q and U parameters across the observing band (black points), due to Faraday rotation, for the observation of PSR B1929+10. The red line shows the theoretical sinusoidal function of Q and U, assuming the determined RM value for this pulsar. The gaps in the frequency coverage are due to flagging of subbands that were affected by RFI. Below c) and d), the residuals from the subtraction of the theoretical function from the data are shown.
Current usage metrics show cumulative count of Article Views (full-text article views including HTML views, PDF and ePub downloads, according to the available data) and Abstracts Views on Vision4Press platform.
Data correspond to usage on the plateform after 2015. The current usage metrics is available 48-96 hours after online publication and is updated daily on week days.
Initial download of the metrics may take a while.