Fig. 2
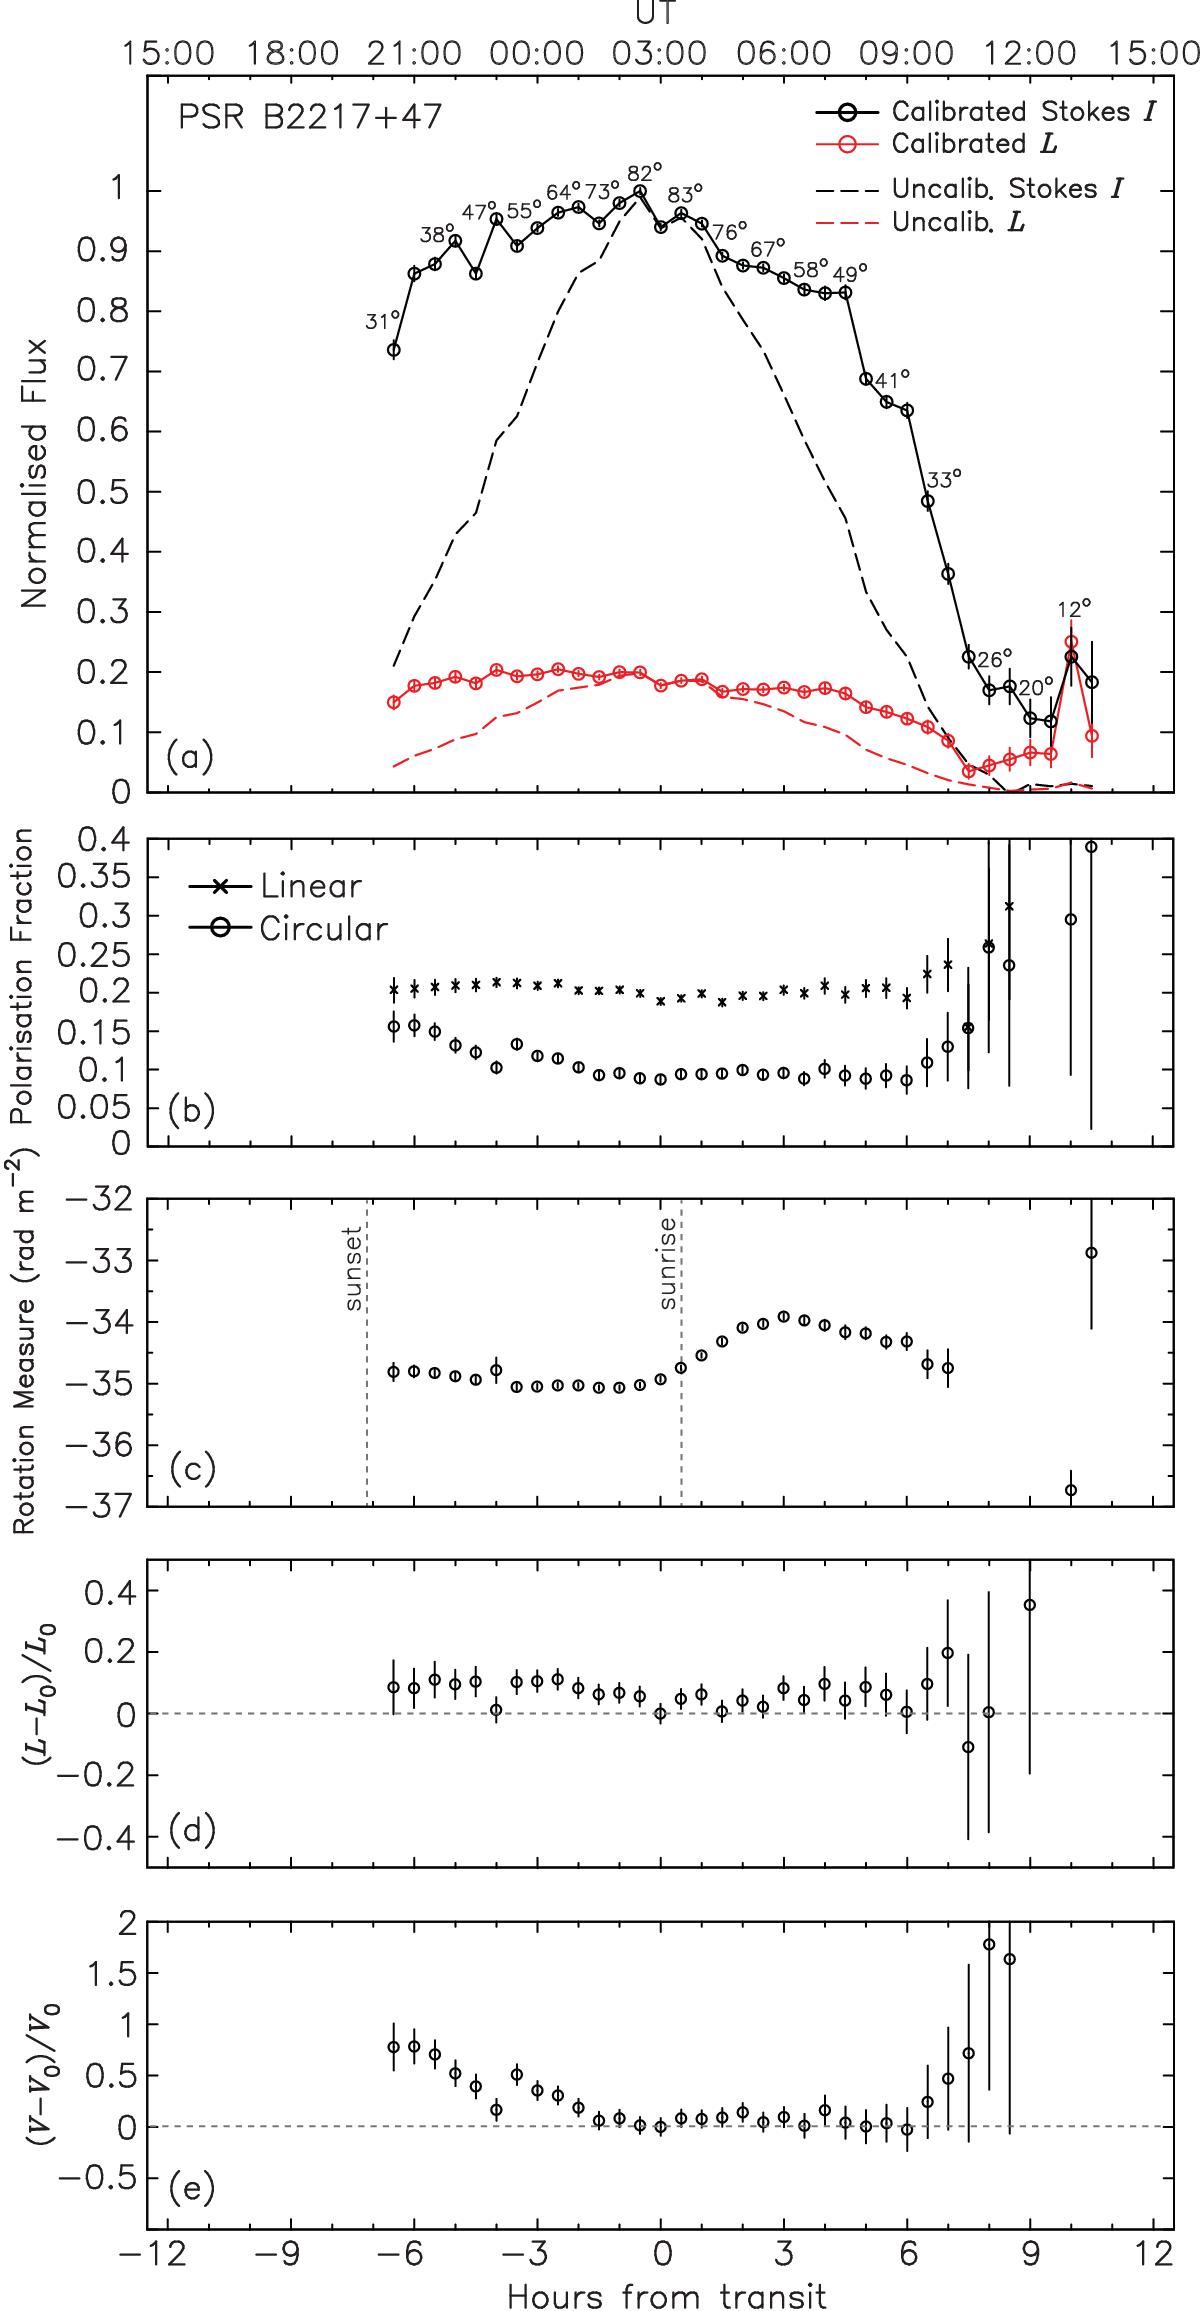
Total and polarised flux density of PSR B2217+47 as a function of hour angle, mapped during the 17-h test observation to evaluate the performance of the calibration model for LOFAR. Each data point corresponds to a 15-min integration, every 30 min. Source transit occurred at 03:00 UT, corresponding to 0 hours from transit on the lower x-axis. Panel a) shows the pulse-averaged flux densities before (dashed black line) and after beam calibration (black circles). Also shown are the pulse-averaged linearly polarised flux densities before (dashed red lines) and after beam calibration and correction for Faraday rotation (red circles), using the corresponding RM values shown in plot c). All values in panel a) have been normalised by the maximum flux value across the observation and each point has been labelled with the elevation of the pulsar at the beginning of each observation. Panel b) shows the linear (crosses) and circular (circles) polarisation fractions after calibration and Faraday rotation correction. Panel c) shows the observed RM varying due to ionospheric Faraday rotation over the 17-h timespan. Times of sunset and sunrise are also marked with grey dashed lines. Panels d) and e) show the fractional change in the pulse-averaged linear polarisation and the pulse-averaged circular polarisation, respectively.
Current usage metrics show cumulative count of Article Views (full-text article views including HTML views, PDF and ePub downloads, according to the available data) and Abstracts Views on Vision4Press platform.
Data correspond to usage on the plateform after 2015. The current usage metrics is available 48-96 hours after online publication and is updated daily on week days.
Initial download of the metrics may take a while.