Fig. 11
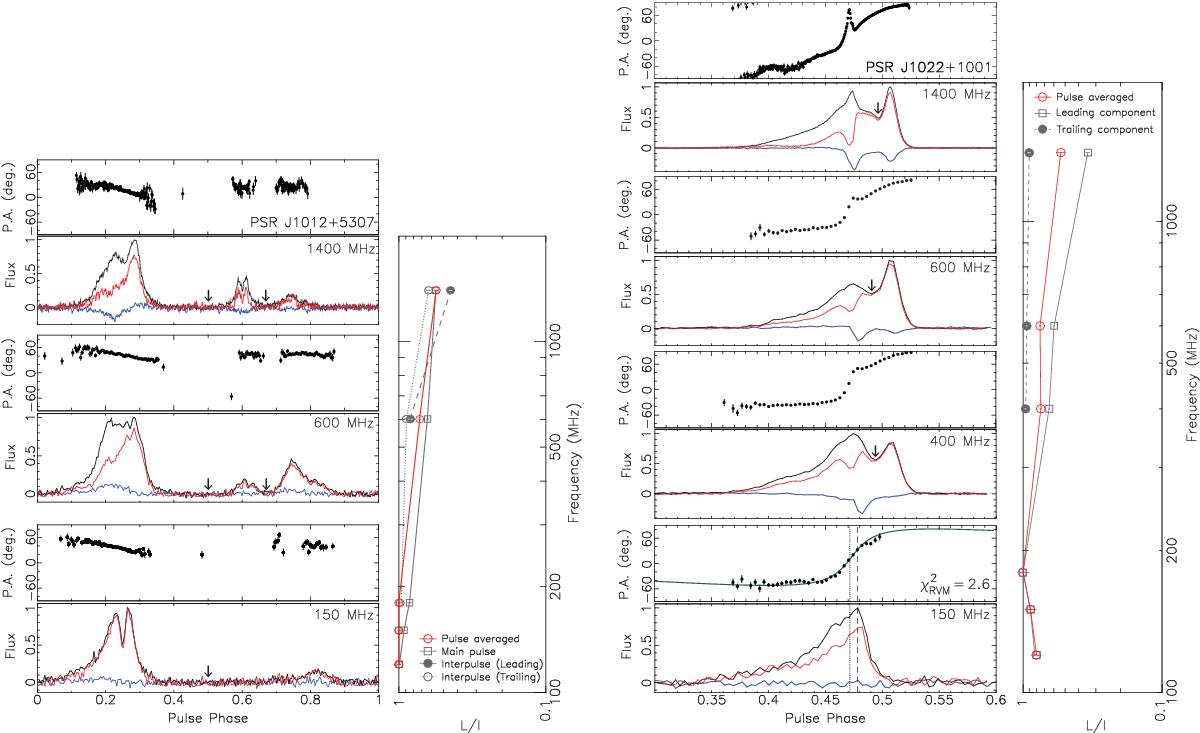
Evolution of the polarisation profiles as a function of observing frequency, for PSRs J1012+5307 and J1022+1001 in our sample. All the flux scales are in arbitrary units. The high-resolution (~ 5μs) profiles at 1400 MHz were obtained by Xilouris et al. (1998) for PSR J1012+5307, and Yan et al. (2011) for PSR J1022+1001. Alongside the profiles, the fraction of linear polarisation as a function of observing frequency is also shown for the pulse averaged flux (red open circles). The linear polarisation fraction as a function of frequency for the phase ranges demarcated by the black arrows is shown with grey symbols. For PSR J1021+5307, the linear polarisation fraction of the main pulse is shown with grey squares; that of the leading and trailing component of the interpulse is shown with grey filled circles and a grey open circles, respectively. For PSR J1022+1001, the linear polarisation fraction for the leading and trailing components are shown with grey squares and grey filled circles, respectively. The best RVM fit to the 150 MHz PA profile of PSR J1022+1001 is show with a green line. The determined value of φ0 from the RVM fit and the phase at the profile’s maximum are shown with vertical dotted and dashed lines, respectively.
Current usage metrics show cumulative count of Article Views (full-text article views including HTML views, PDF and ePub downloads, according to the available data) and Abstracts Views on Vision4Press platform.
Data correspond to usage on the plateform after 2015. The current usage metrics is available 48-96 hours after online publication and is updated daily on week days.
Initial download of the metrics may take a while.