Fig. 9
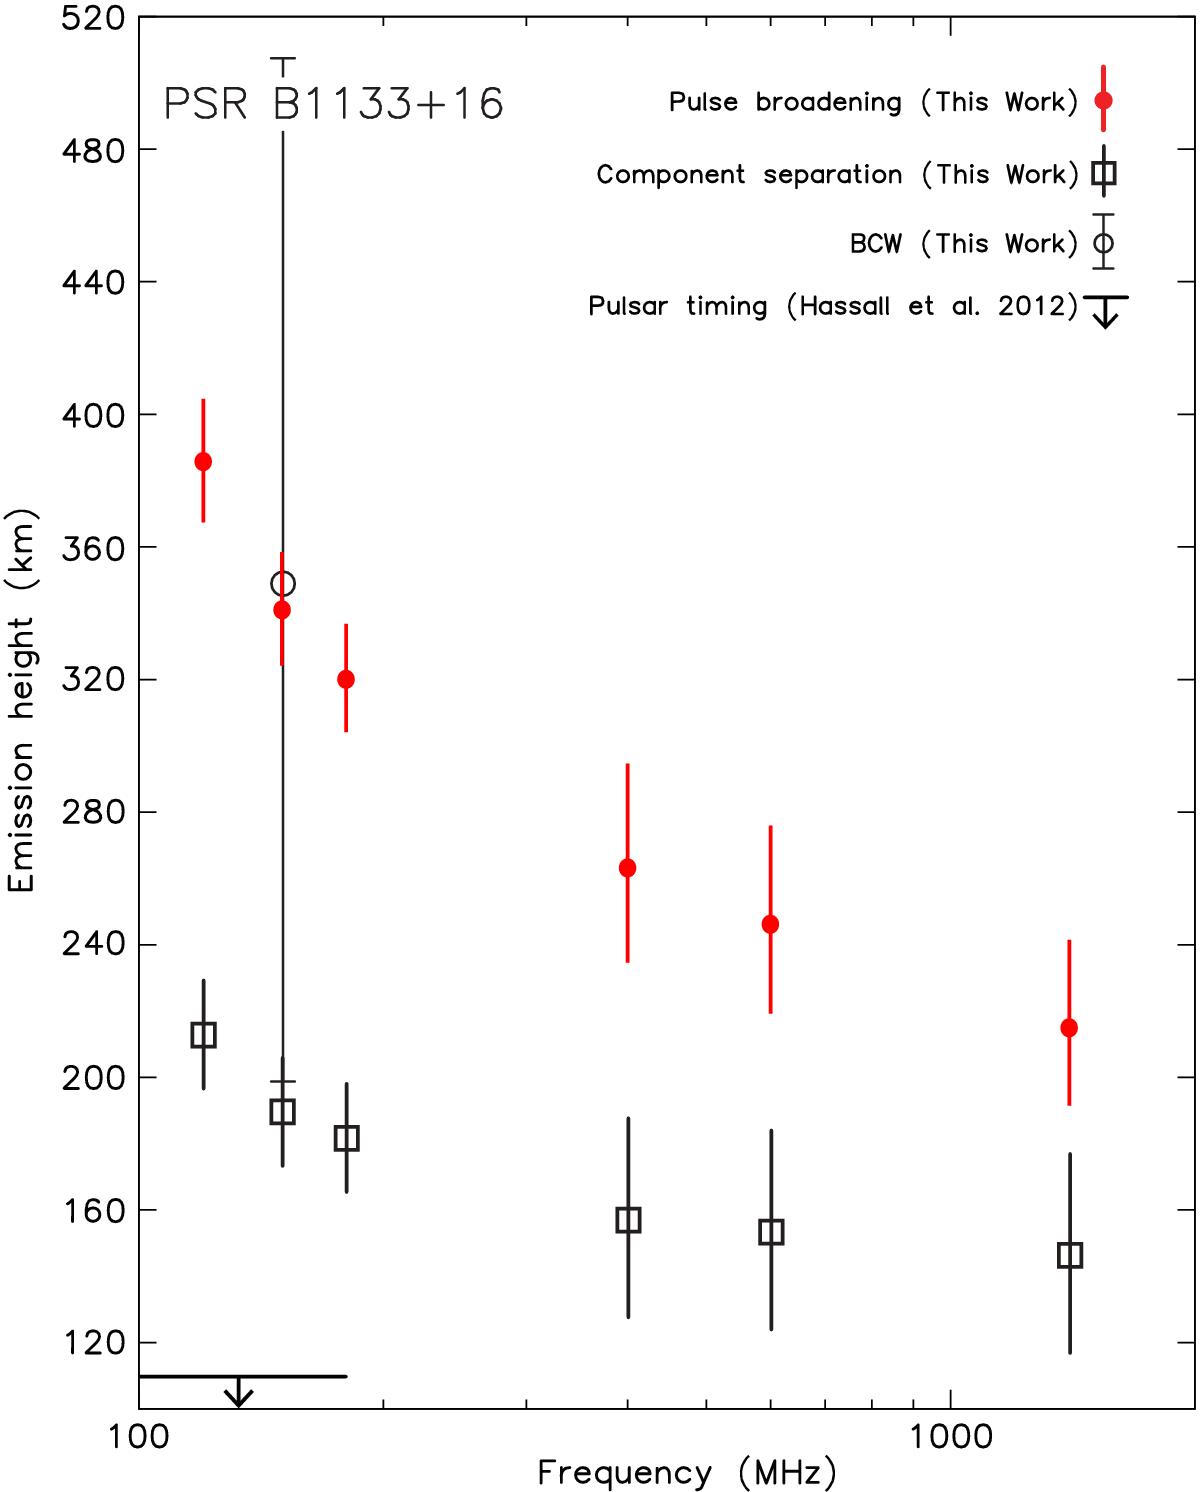
Emission heights at different observing frequencies, for PSR B1133+16, based on pulse broadening (filled red circles) and component separation (open squares), and the assumption that the observed emission is coupled to the last open field-lines of the pulsar’s dipolar magnetic field. For comparison, we also show with an open circle the emission height estimate based on the delay-radius relation of Blaskiewicz, Cordes and Wasserman and our polarisation observations at 150 MHz (Table 2). Finally, the upper limit on the emission height from pulsar-timing measurements by Hassall et al. (2012), between 40 and 180 MHz, is shown with an arrow.
Current usage metrics show cumulative count of Article Views (full-text article views including HTML views, PDF and ePub downloads, according to the available data) and Abstracts Views on Vision4Press platform.
Data correspond to usage on the plateform after 2015. The current usage metrics is available 48-96 hours after online publication and is updated daily on week days.
Initial download of the metrics may take a while.