Fig. 8
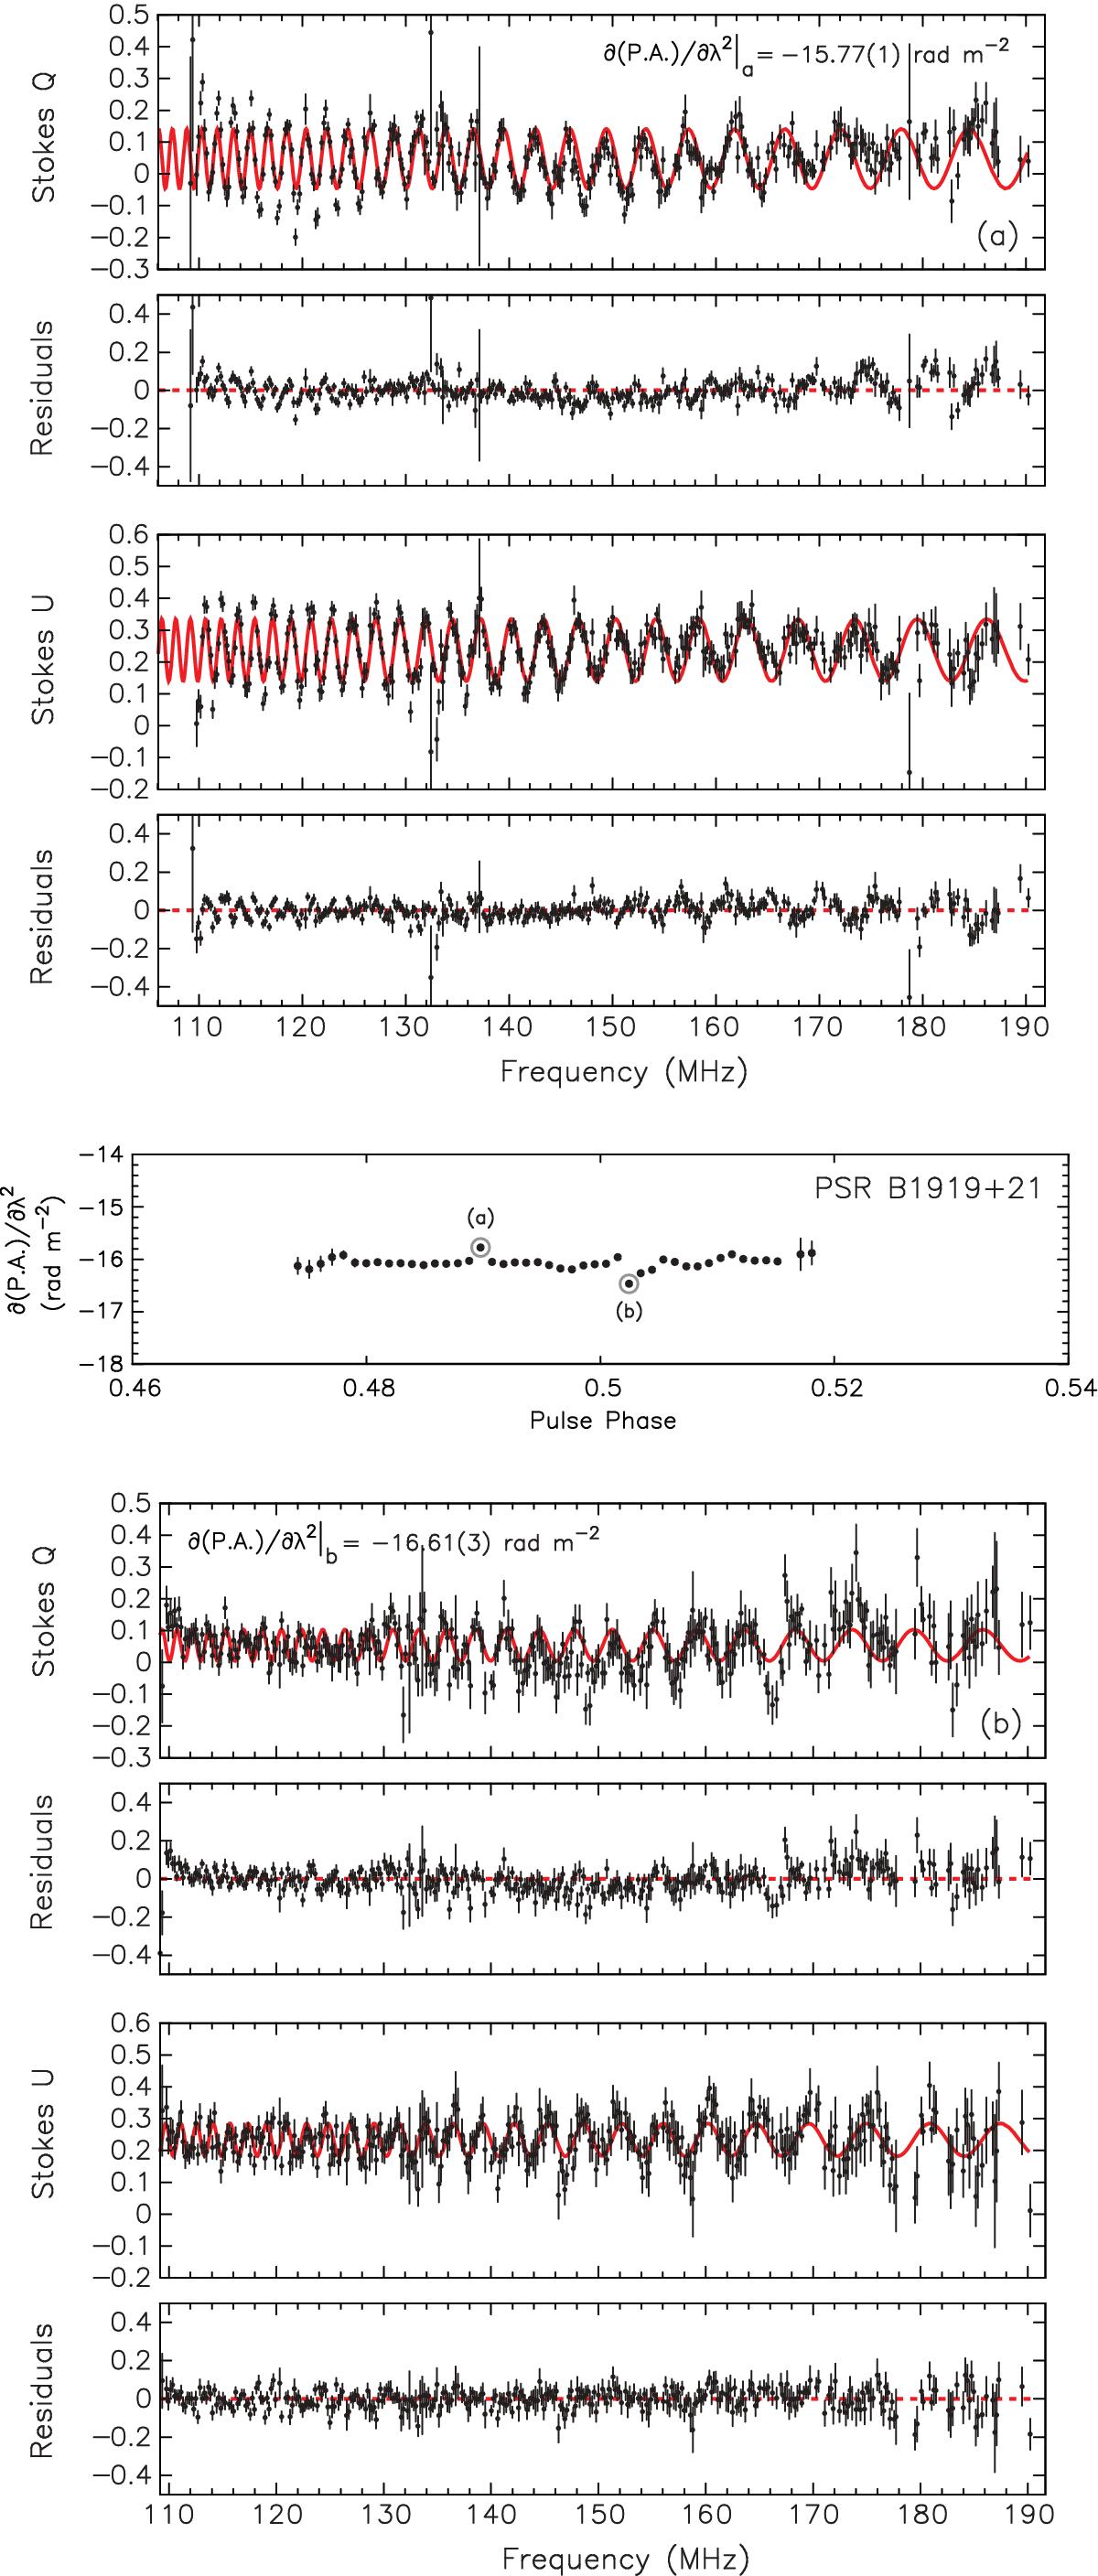
Scatter plots of the variation of the Stokes Q and U parameters across the HBA band, calculated for the two pulse phases of PSR B1919+21 that correspond to a) the maximum (−15.77(1) rad m-2) and b) the minimum value (−16.61(3) rad m-2) of the first derivative of the PA with respect to λ2 (middle plot; the selected phases are highlighted with grey circles). The expected periodicity of the Stokes parameters with frequency, based on the above values of ∂PA /∂λ2, is shown for each case with a red curve. The residual difference between the expected variation and the data is plotted below each of the Stokes Q and U plots, where the dashed red line corresponds to zero residual difference.
Current usage metrics show cumulative count of Article Views (full-text article views including HTML views, PDF and ePub downloads, according to the available data) and Abstracts Views on Vision4Press platform.
Data correspond to usage on the plateform after 2015. The current usage metrics is available 48-96 hours after online publication and is updated daily on week days.
Initial download of the metrics may take a while.