Fig. 8
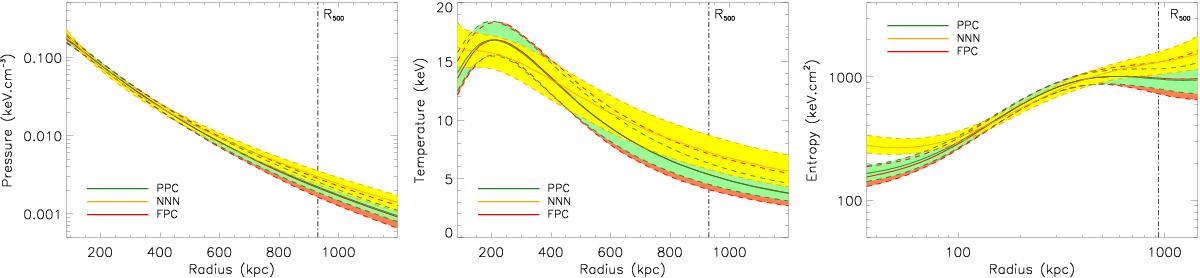
Pressure (left), temperature (middle) and entropy (right) profiles as a function of physical distance from the cluster center. The green, yellow, and red swaths provide the 68% confidence limit, accounting for both calibration and statistical uncertainties. They correspond to modeling of the pressure profile with different choices for slope parameters ![]() as written in the legend. Once projected, a distance of 500 kpc corresponds to about 1 arcmin at the cluster redshift.
as written in the legend. Once projected, a distance of 500 kpc corresponds to about 1 arcmin at the cluster redshift.
Current usage metrics show cumulative count of Article Views (full-text article views including HTML views, PDF and ePub downloads, according to the available data) and Abstracts Views on Vision4Press platform.
Data correspond to usage on the plateform after 2015. The current usage metrics is available 48-96 hours after online publication and is updated daily on week days.
Initial download of the metrics may take a while.