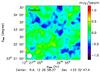
Fig. 5
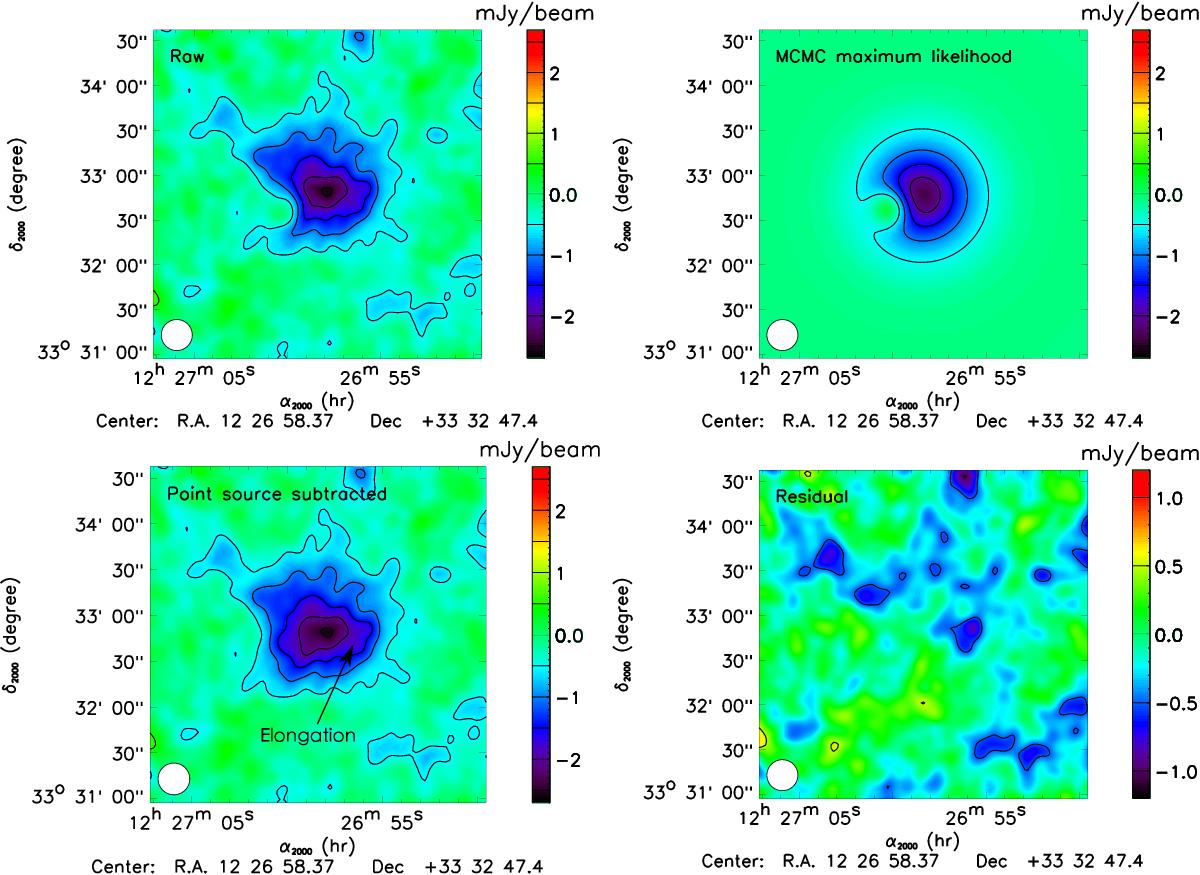
Top left: NIKA 150 GHz raw map of CL J1226.9+3332. Top right: MCMC maximum likelihood tSZ + point source model. Bottom left: point-source-subtracted map. Bottom right: tSZ + point-source-subtracted residual map. The contours are spaced by 0.5 mJy/beam, and the maps have been smoothed with a 10 arcsec Gaussian filter. The effective beam is shown in the bottom left corner of each map.
Current usage metrics show cumulative count of Article Views (full-text article views including HTML views, PDF and ePub downloads, according to the available data) and Abstracts Views on Vision4Press platform.
Data correspond to usage on the plateform after 2015. The current usage metrics is available 48-96 hours after online publication and is updated daily on week days.
Initial download of the metrics may take a while.