Free Access
Fig. 4
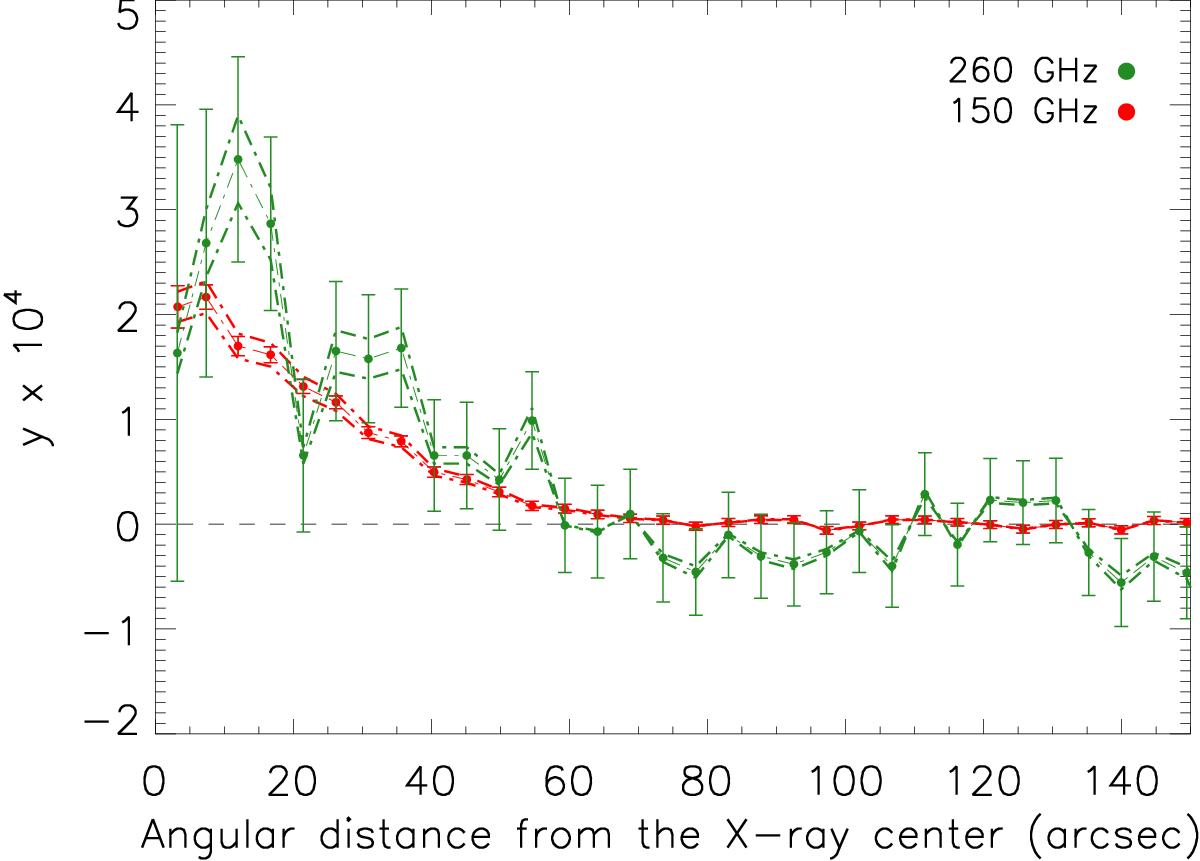
Compton parameter profile y of CL J1226.9+3332 at 150 GHz (red) and 260 GHz (green). The point source has been subtracted before extracting the profile. Statistical uncertainties are shown as error bars, and systematic uncertainties are given as a dashed-line envelope.
Current usage metrics show cumulative count of Article Views (full-text article views including HTML views, PDF and ePub downloads, according to the available data) and Abstracts Views on Vision4Press platform.
Data correspond to usage on the plateform after 2015. The current usage metrics is available 48-96 hours after online publication and is updated daily on week days.
Initial download of the metrics may take a while.