Fig. 9
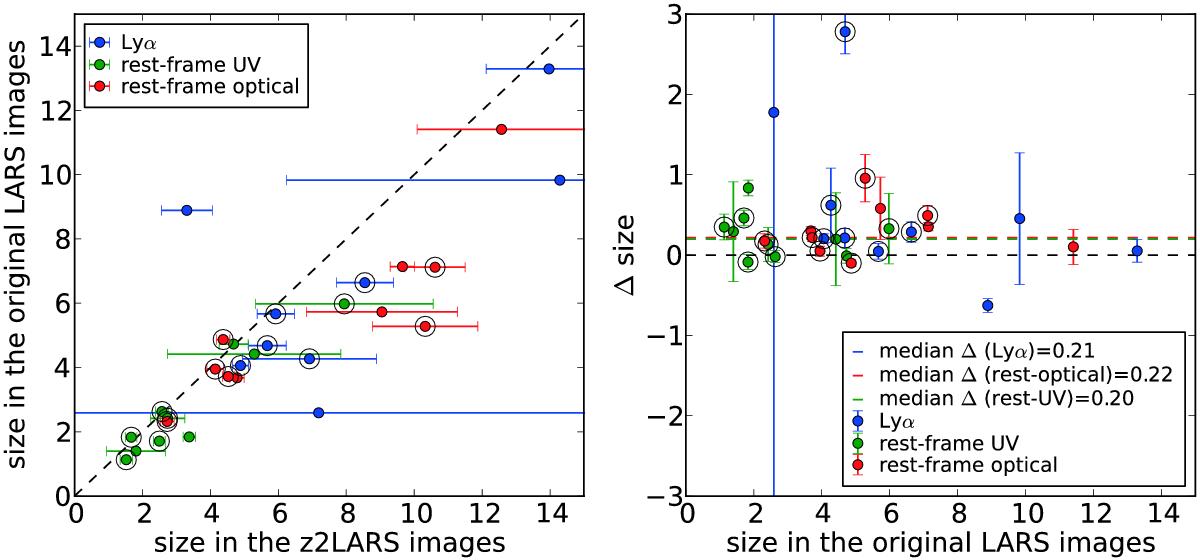
Left: rP20ell (kpc) measured in the original LARS images as a function of the value from the high-z simulated ones. The 1:1 relation is shown as a dashed line. Right: Δsize = ![]() as a function of rP20ell measured in the original LARS images. The black dashed line indicates Δ = 0; the dashed blue, green, and red lines the median Δ values for Lyα, rest-frame UV, and optical. Open circles indicate LARS-LAEs; blue, green, and red dots correspond to the measurements in Lyα, rest-frame UV, and optical images.
as a function of rP20ell measured in the original LARS images. The black dashed line indicates Δ = 0; the dashed blue, green, and red lines the median Δ values for Lyα, rest-frame UV, and optical. Open circles indicate LARS-LAEs; blue, green, and red dots correspond to the measurements in Lyα, rest-frame UV, and optical images.
Current usage metrics show cumulative count of Article Views (full-text article views including HTML views, PDF and ePub downloads, according to the available data) and Abstracts Views on Vision4Press platform.
Data correspond to usage on the plateform after 2015. The current usage metrics is available 48-96 hours after online publication and is updated daily on week days.
Initial download of the metrics may take a while.