Fig. 7
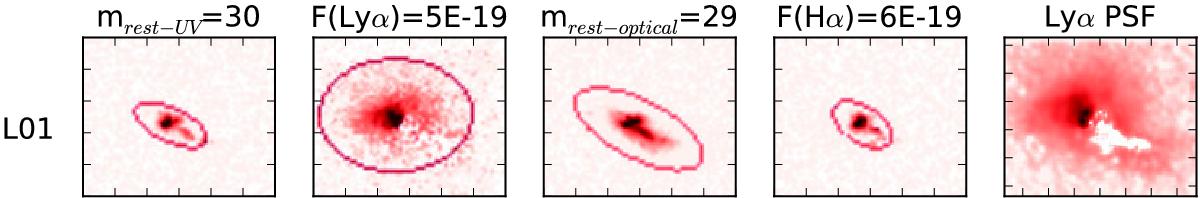
Simulated z ~ 2 rest-frame UV, Lyα, rest-frame optical, and Hα emission for L01 as it would be observed in the deepest surveys probed here (first four panels starting from the left). The last panel shows the original-pixel-scale Lyα image convolved with a Gaussian kernel, resembling a ground-based seeing point spread function, PSF, of 1.32′′. Every panel is 20 × 17 kpc wide. The reddish ellipses indicate SEx apertures, corresponding to the assumed detection parameters: DETECT_THRESH = 1.65, DETECT_MINAREA=30, and DEBLEND_MINCONT = 1 from Bond et al. (2009). The log colour scaling is chosen to show a visually consistent background noise.
Current usage metrics show cumulative count of Article Views (full-text article views including HTML views, PDF and ePub downloads, according to the available data) and Abstracts Views on Vision4Press platform.
Data correspond to usage on the plateform after 2015. The current usage metrics is available 48-96 hours after online publication and is updated daily on week days.
Initial download of the metrics may take a while.