Fig. 4
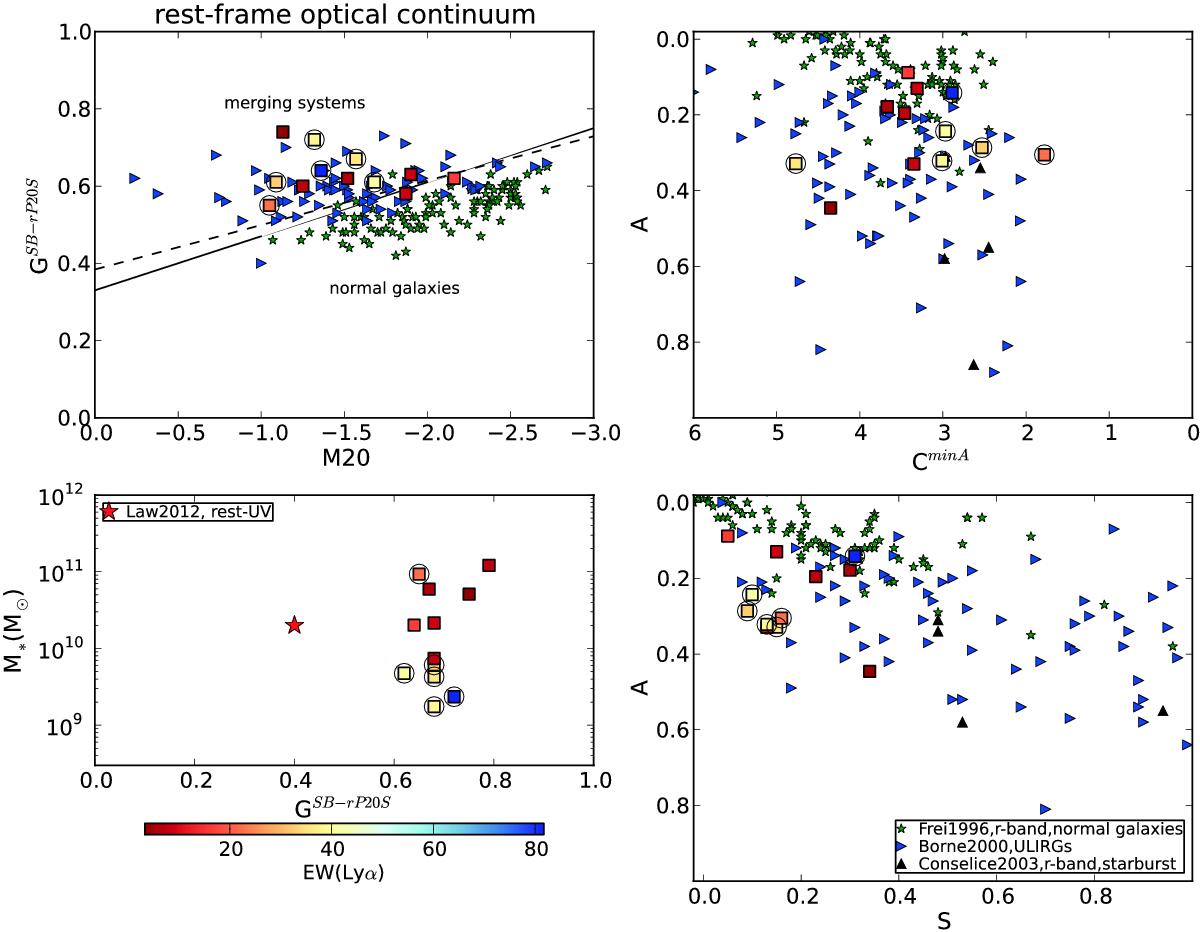
Combinations of rest-frame optical morphological measurements, used in the literature as diagnostics of galaxy past and current history. GSB − rP20S vs. M20 (upper left), A vs. CminA (upper right), and A vs. S (lower right). The lower left panel shows stellar mass vs. the rest-frame UV GSB − rP20S. The typical value of GSB − rP20S = 0.4 for the strongest Lyα emitters of the sample by Law et al. (2012) is reported as a red star. The twelve LARS galaxies analysed here are presented as squares, LARS-LAEs are rounded by open circles. The colour scale corresponds to EW(Lyα). For comparison, green stars correspond to the Frei et al. (1996) sample of normal galaxies and light blue triangles correspond to the ULIRG sample of Borne et al. (2000) as processed by Lotz et al. (2004). Black triangles correspond to a sample of starburst galaxies presented in Conselice (2003). Dashed and solid lines correspond to the separation between ULIRGs and normal galaxies, proposed by Lotz et al. (2004) and Lotz et al. (2008) respectively (see text).
Current usage metrics show cumulative count of Article Views (full-text article views including HTML views, PDF and ePub downloads, according to the available data) and Abstracts Views on Vision4Press platform.
Data correspond to usage on the plateform after 2015. The current usage metrics is available 48-96 hours after online publication and is updated daily on week days.
Initial download of the metrics may take a while.