Free Access
Fig. C.1
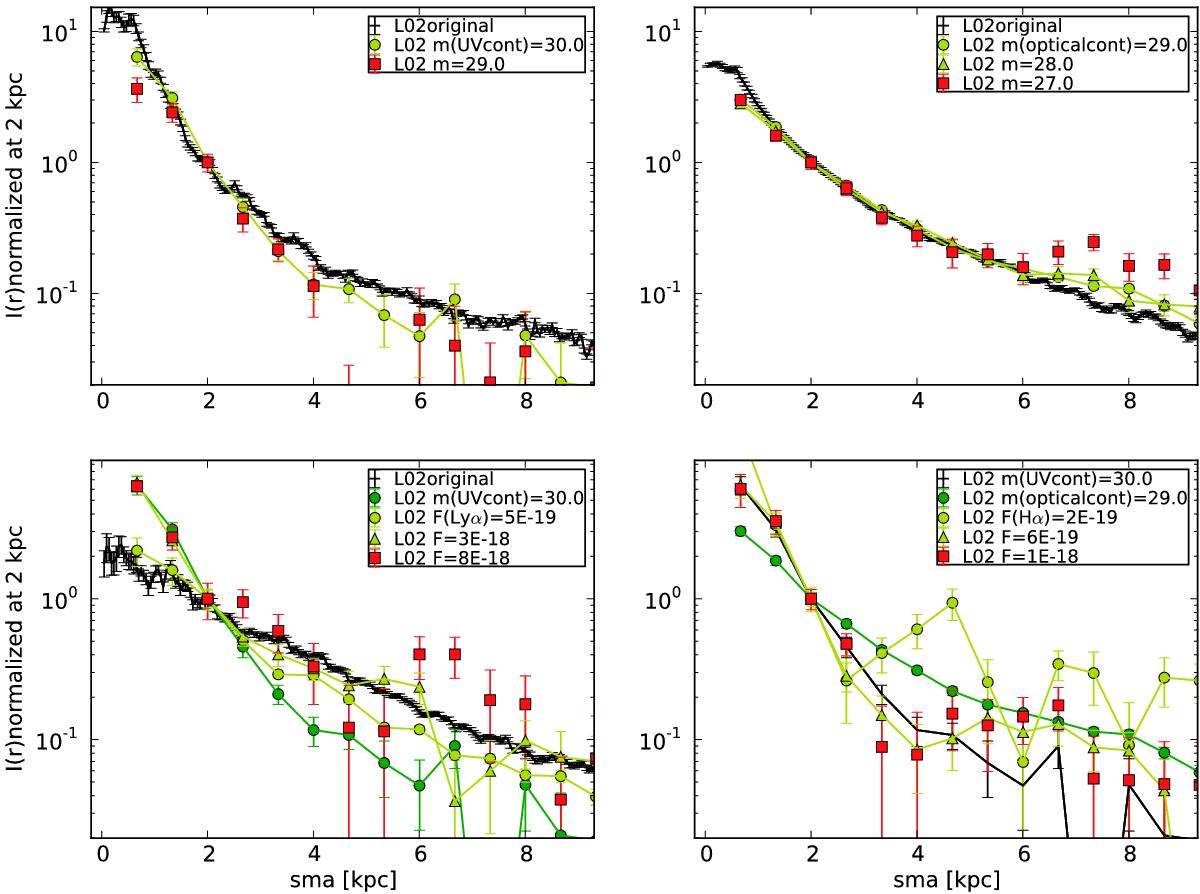
Normalized surface brightness profiles of L02. Black points with error bars correspond to the surface brightness profile of the original LARS images in the rest-frame UV, optical, and Lyα as explained in the text (Fig. 8). The red squares represent the profile affected by background noise, for a certain shallow survey.
Current usage metrics show cumulative count of Article Views (full-text article views including HTML views, PDF and ePub downloads, according to the available data) and Abstracts Views on Vision4Press platform.
Data correspond to usage on the plateform after 2015. The current usage metrics is available 48-96 hours after online publication and is updated daily on week days.
Initial download of the metrics may take a while.