Free Access
Fig. B.6
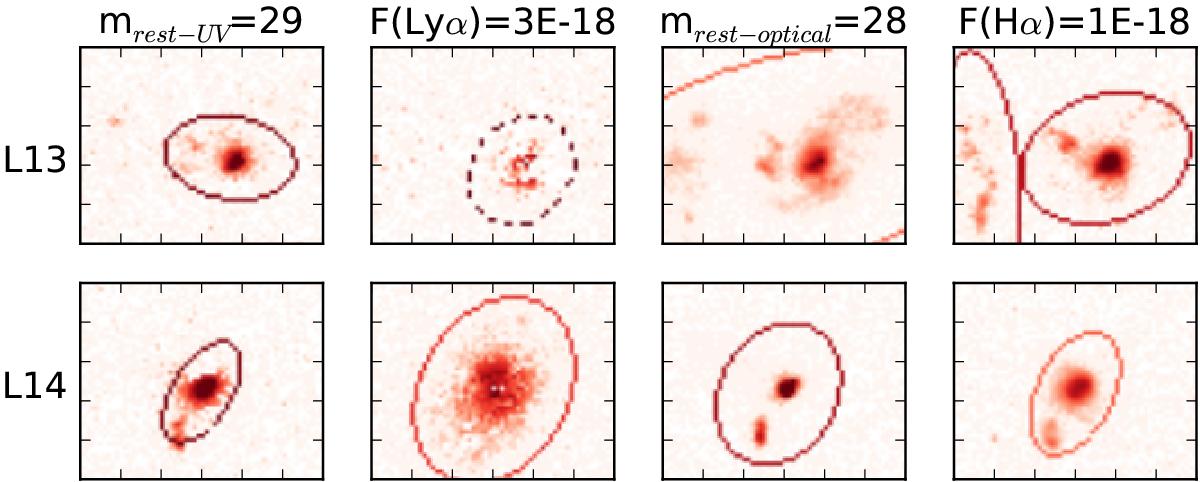
As Fig. B.3, but for a shallow simulated survey. Only the bright right clump of z2L13 is detected in UV at a 10σ detection limit of mrest − UV = 29. Its Lyα emission is localized around the lower side of the right clump. In Hα the two overlapping sources become well separated.
Current usage metrics show cumulative count of Article Views (full-text article views including HTML views, PDF and ePub downloads, according to the available data) and Abstracts Views on Vision4Press platform.
Data correspond to usage on the plateform after 2015. The current usage metrics is available 48-96 hours after online publication and is updated daily on week days.
Initial download of the metrics may take a while.