Fig. A.4
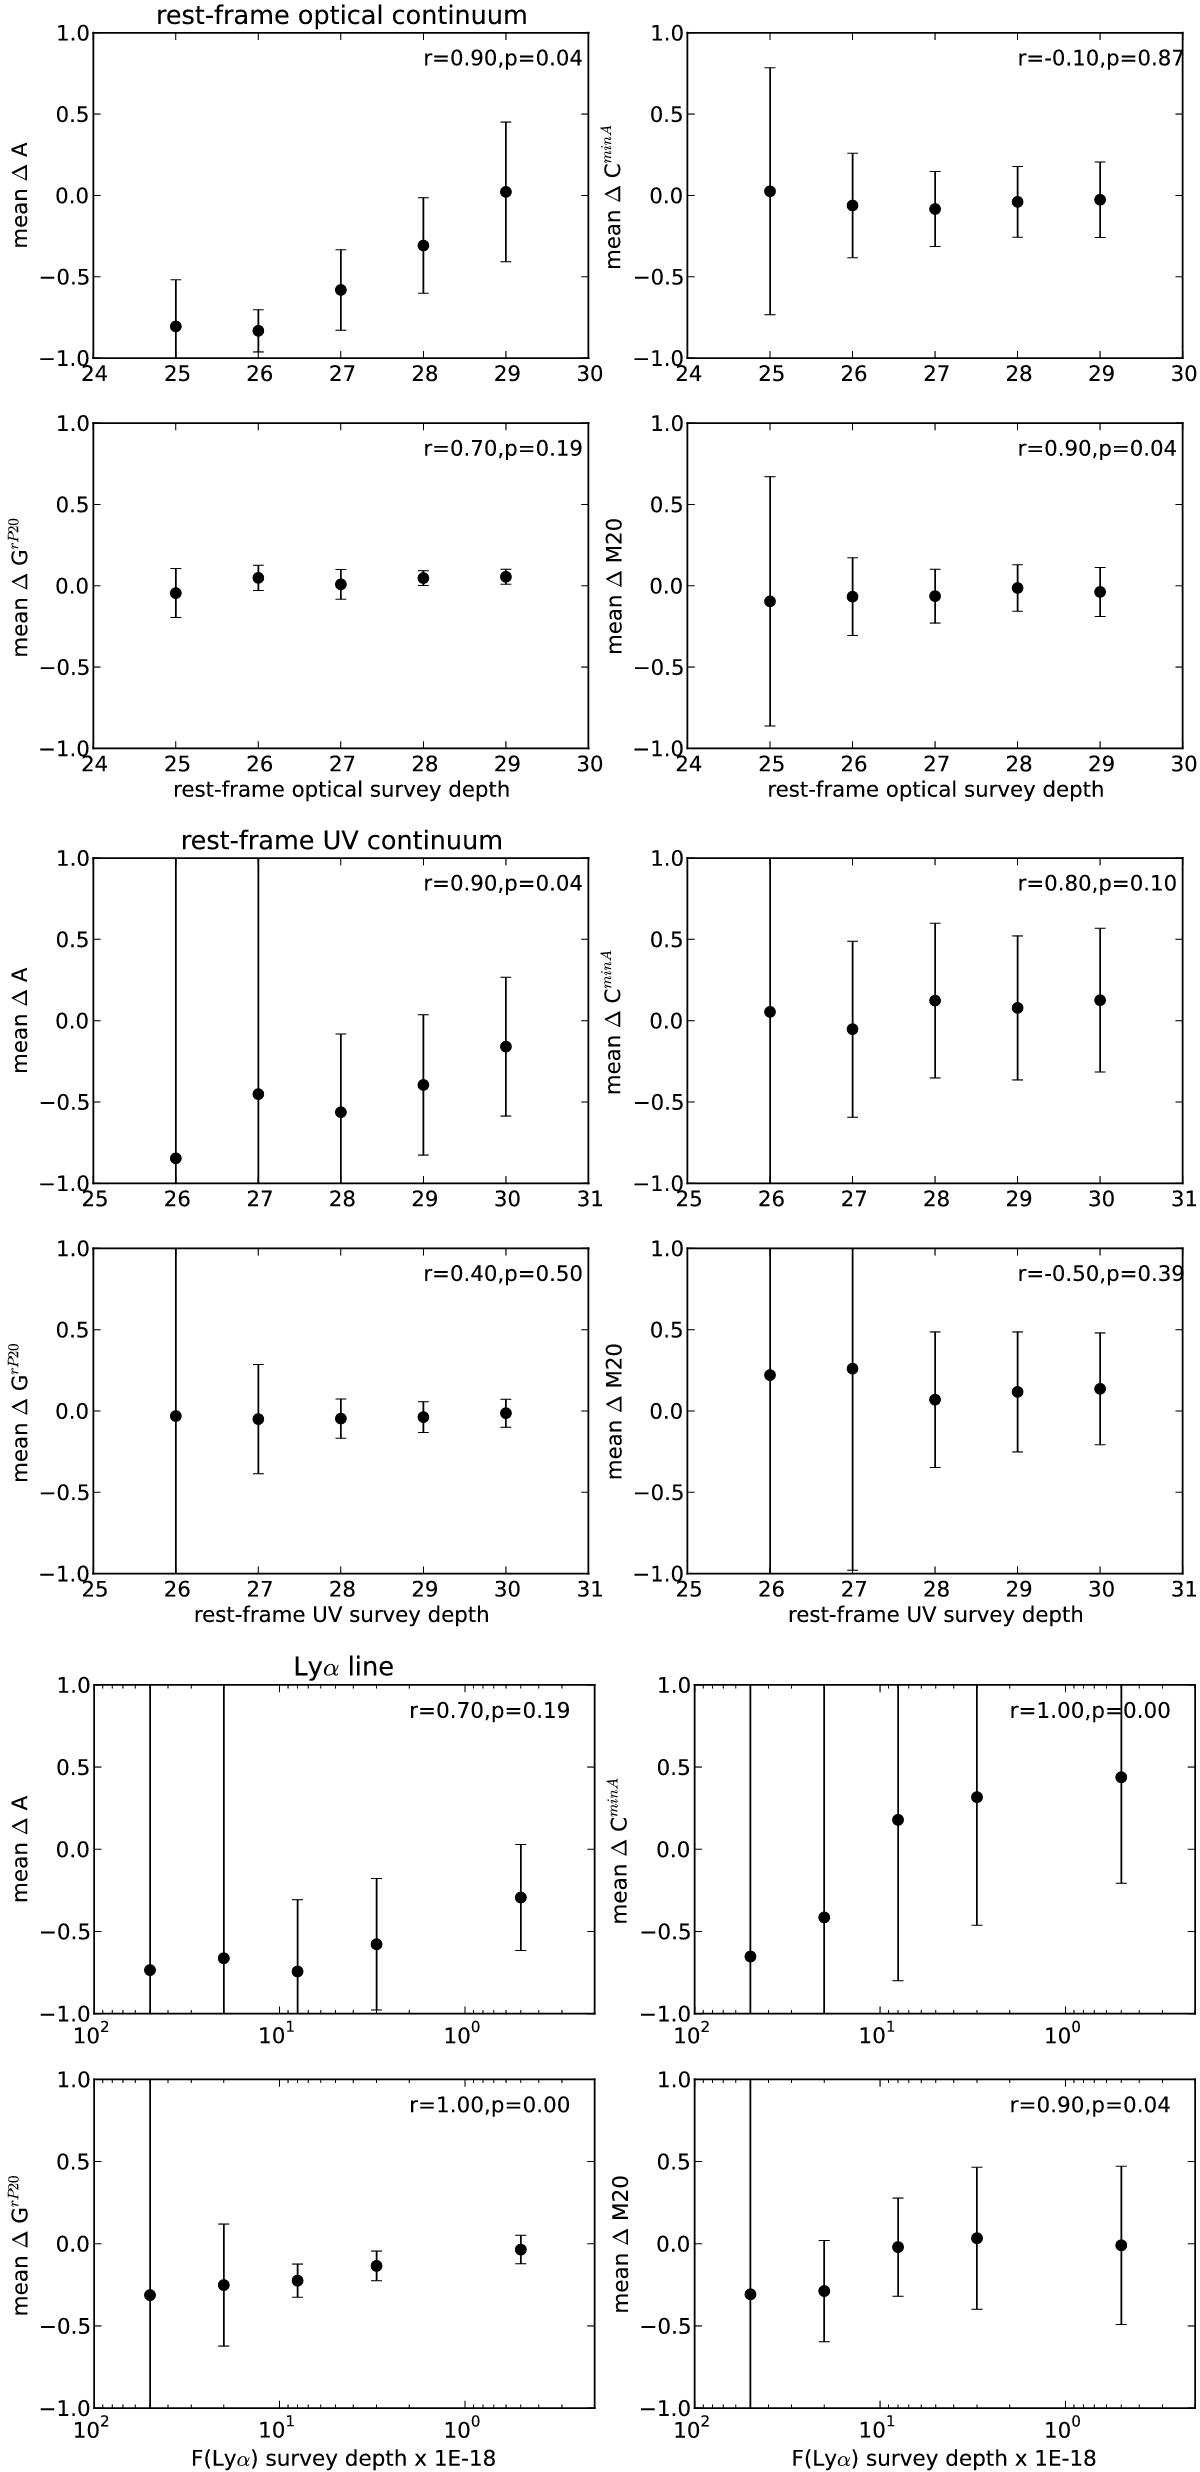
Mean Δ(param) as defined in Eq. (A.1) vs. simulated survey depth. param is A (upper left), CminA (upper right), GrP20 (lower left), and M20 (lower right) for the rest-frame optical, UV, and Lyα simulated images. The deepest simulated survey is represented by the most right data point in each panel. The error bars represent the standard deviation among all the high-z simulated LARS galaxies. In the case fewer-than-twelve galaxies are detected at a specific depth, the error bars is increased proportionally to the number of undetected galaxies. The numbers on the top right corner of each panel represent the Spearman test coefficient, r, and probability, p, of uncorrelated datasets, assuming that the depth vector indicates the deepest survey on the right of the x-axis.
Current usage metrics show cumulative count of Article Views (full-text article views including HTML views, PDF and ePub downloads, according to the available data) and Abstracts Views on Vision4Press platform.
Data correspond to usage on the plateform after 2015. The current usage metrics is available 48-96 hours after online publication and is updated daily on week days.
Initial download of the metrics may take a while.