Fig. 2
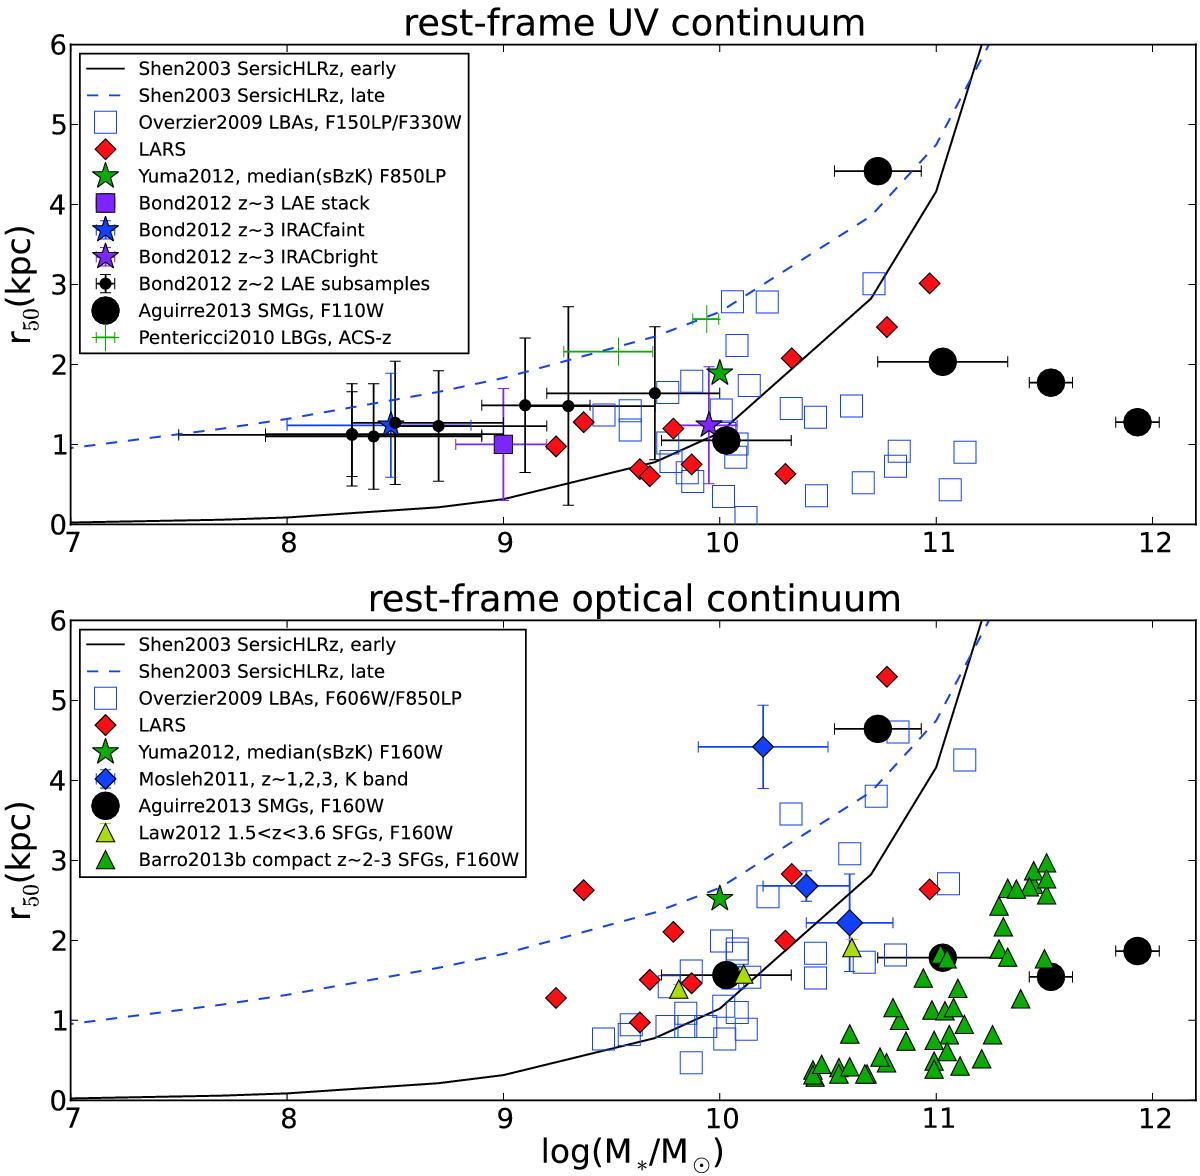
Half-light radius measured using elliptical apertures in the rest-frame UV (upper panel) and optical (lower panel) as a function of stellar mass. LARS values at z ~ 0 from this work (red diamonds) are shown together with previous rest-frame UV measurements: Overzier et al. (2009) individual LBA values estimated in the HST ACS/SBC F150LP and ACS/HRC F330W filter (open blue squares), Yuma et al. (2012) median estimations in the F850W filter for sBzK (green star), Bond et al. (2012) LAE sample stack and subsamples (magenta square, blue and magenta stars, small black circle), Aguirre et al. (2013) individual SMG values measured in the HST F110W filter (big black dots), and Pentericci et al. (2010) average values of LBGs with and without Lyα in emission (green dots); and rest-frame optical measurements: Overzier et al. (2009) individual LBA values estimated in the HST (Wide Field and Planetary Camera2) WFPC2/F606W and ACS/WFC F850LP filter (open blue squares), Yuma et al. (2012) median estimations in the F160W filter for sBzK (green star), Mosleh et al. (2011) median values of UV-bright sources (GALEX-LBGs at z ~ 0.6 − 1.5, LBG at z ~ 2.5 − 3.5, and continuum-selected star-forming galaxies at z ~ 1.5 − 2.5, blue diamonds), Aguirre et al. (2013) individual SMG values measured in F160W filter, Law et al. (2012) mean value of all the sample of star-forming galaxies at 1.5 <z< 3.6 estimated in the F160W filter (yellow triangles), and Barro et al. (2013) values for compact star-forming galaxies at 2 <z< 3 also calculated in the F160W filter (green triangles). We also show the curve derived by Shen et al. (2003) for local SDSS early- and late-type galaxies. As these curves were obtained in z-bands for local galaxies, it is more meaningful to compare them to the radii in the rest-frame optical. However, for reference, we show them in the upper panel as well. The stellar masses are all corrected to Salpeter-IMF values and the size measurements are all scaled to be comparable to half-light radii. LARS stellar masses were calculated in Paper II. L09 and L11 are outside the graph, due to their half-light radius larger than 6 kpc.
Current usage metrics show cumulative count of Article Views (full-text article views including HTML views, PDF and ePub downloads, according to the available data) and Abstracts Views on Vision4Press platform.
Data correspond to usage on the plateform after 2015. The current usage metrics is available 48-96 hours after online publication and is updated daily on week days.
Initial download of the metrics may take a while.