Fig. 16
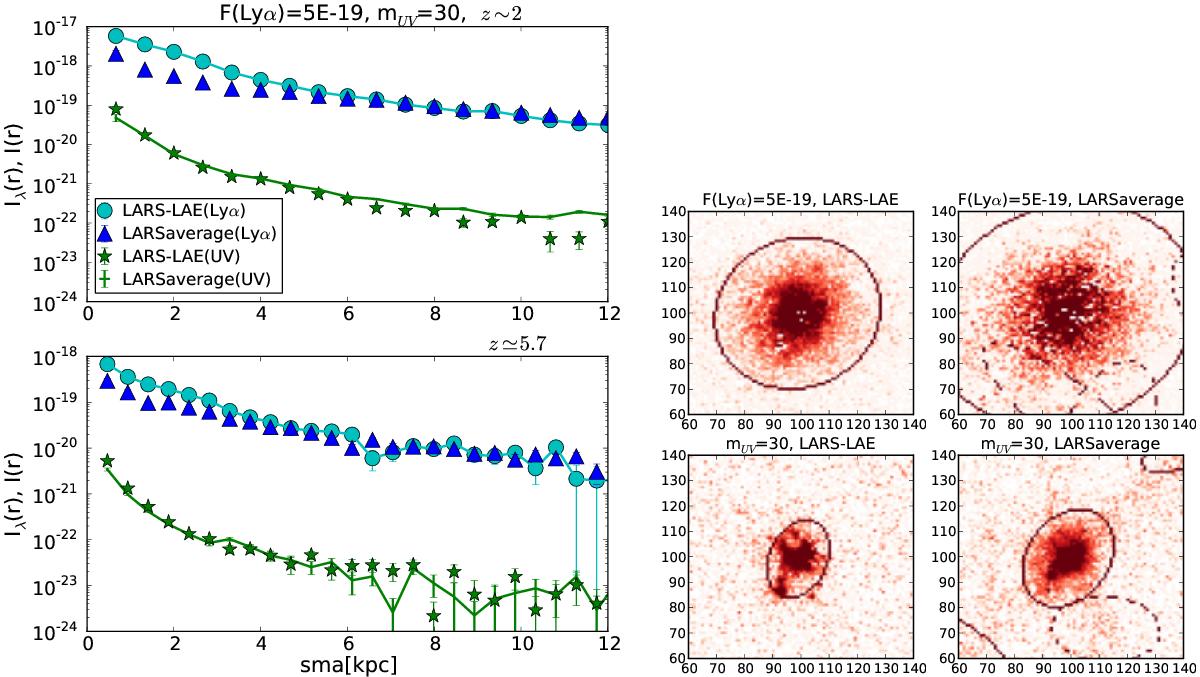
Left: surface brightness profiles for Lyα (units of erg s-1 cm-2 kpc-2) at z ~ 2 (upper panel). LARS-LAEs are shown with the cyan circles and line, and LARSaverage with (blue triangles). Rest UV profiles (units of erg s-1 cm-2 kpc-2 Å-1) are shown for the LARS-LAE sample (green stars) and LARSaverage (green line with errorbars). The lower panel shows the equivalent profiles at z = 5.7. Right: from the upper left to the lower right: Lyα for the LARS-LAE and LARSaverage stacks; rest-frame UV continuum for LARS-LAEs and LARSaverage. The logarithmic colour scale is adjusted to match the background level. The elongated structures in the LARSaverage continuum frame come from L09 (vertical) and L11 (diagonal). The whitish structures in the LARSaverage Lyα come from the same galaxies, which are weak Lyα emitters but show strong absorption centrally. The cut-out size is about 15 kpc.
Current usage metrics show cumulative count of Article Views (full-text article views including HTML views, PDF and ePub downloads, according to the available data) and Abstracts Views on Vision4Press platform.
Data correspond to usage on the plateform after 2015. The current usage metrics is available 48-96 hours after online publication and is updated daily on week days.
Initial download of the metrics may take a while.