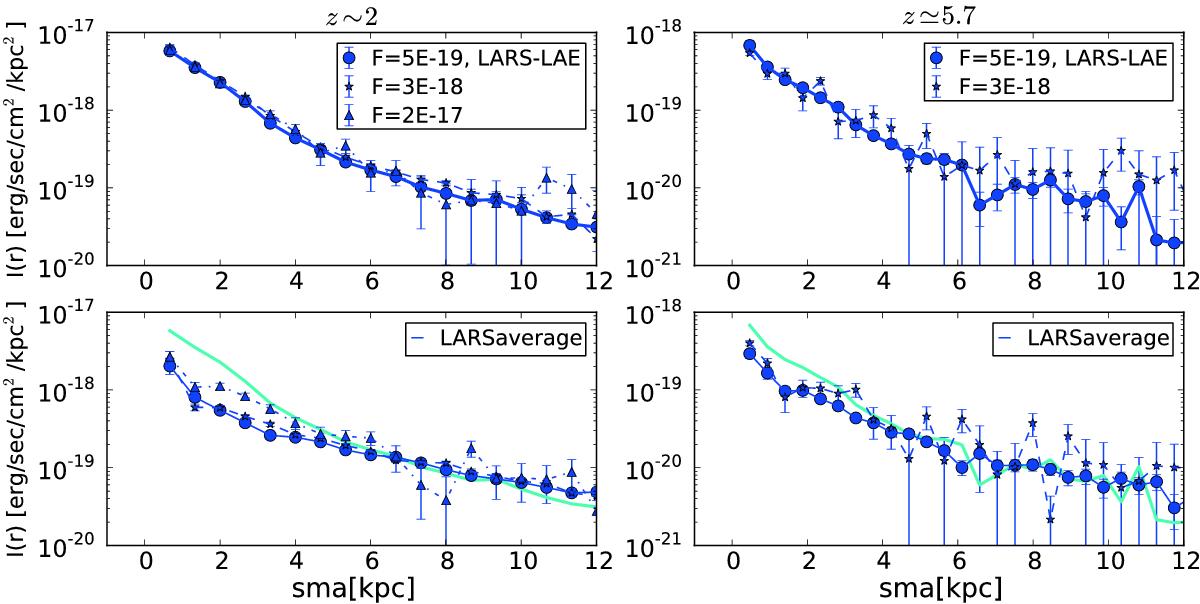
Fig. 15

Lyα surface brightness profiles of the two stacks: LARS-LAE (upper) and LARSaverage (lower; see text for details). Left and right panels show the profiles at z ~ 2 and 5.7, respectively, corresponding to three and two 10σ detection limits (blue circles, stars, and triangles). The cyan solid line represents the LARS-LAE profile of the deepest simulated survey and it is shown in the lower panels for comparison. The difference in the surface brightnesses in the left and right panels is the result of surface brightness dimming. The error bars correspond to the shallowest survey in each panel; for the other depths they are usually smaller than the symbols. The large error bars at sma >5 kpc are produced by background noise.
Current usage metrics show cumulative count of Article Views (full-text article views including HTML views, PDF and ePub downloads, according to the available data) and Abstracts Views on Vision4Press platform.
Data correspond to usage on the plateform after 2015. The current usage metrics is available 48-96 hours after online publication and is updated daily on week days.
Initial download of the metrics may take a while.


