Free Access
Fig. 1
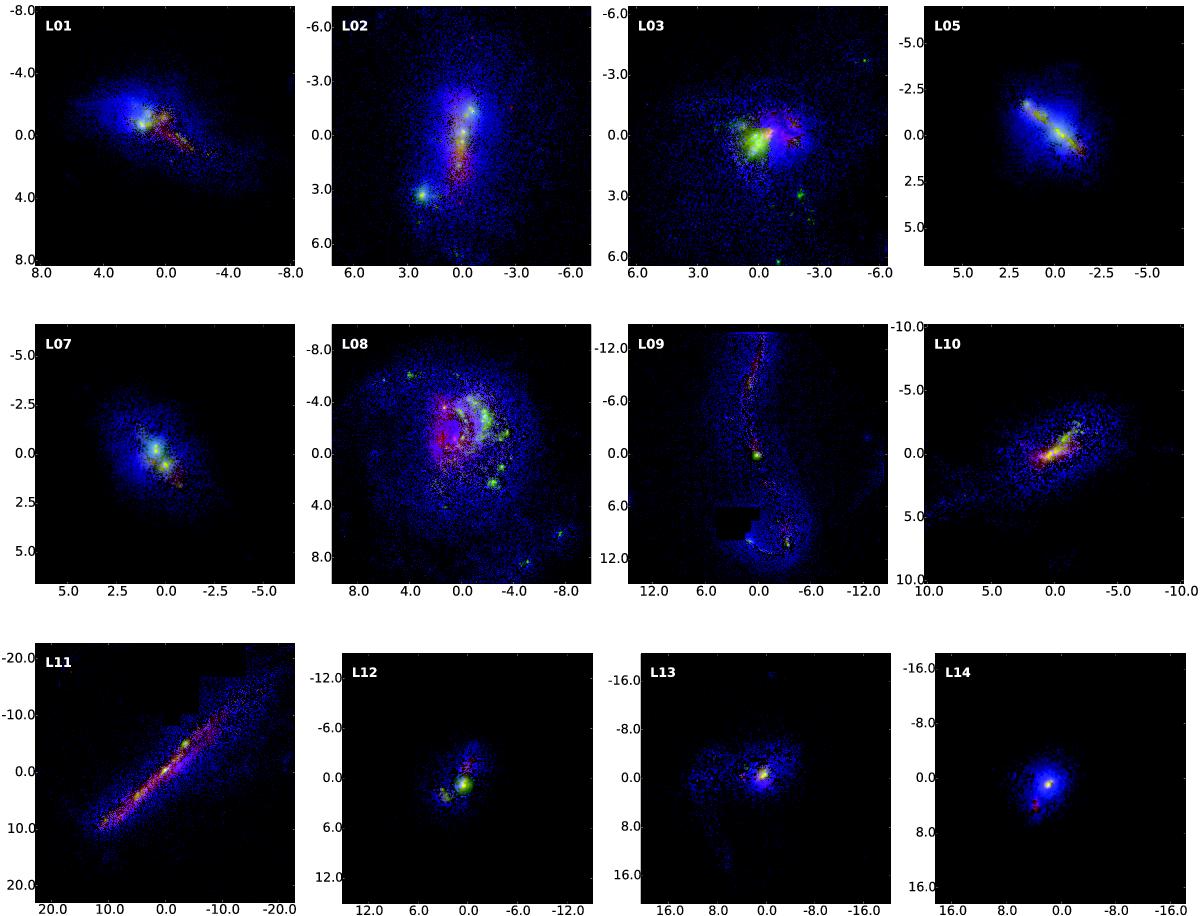
False-colour images of the LARS galaxies analysed in this paper. Red encodes rest-frame optical continuum, green rest-frame UV continuum, and blue shows continuum-subtracted Lyα. Scales in kpc are given on the side. Intensity cut levels are set to show details.
Current usage metrics show cumulative count of Article Views (full-text article views including HTML views, PDF and ePub downloads, according to the available data) and Abstracts Views on Vision4Press platform.
Data correspond to usage on the plateform after 2015. The current usage metrics is available 48-96 hours after online publication and is updated daily on week days.
Initial download of the metrics may take a while.