Fig. 2
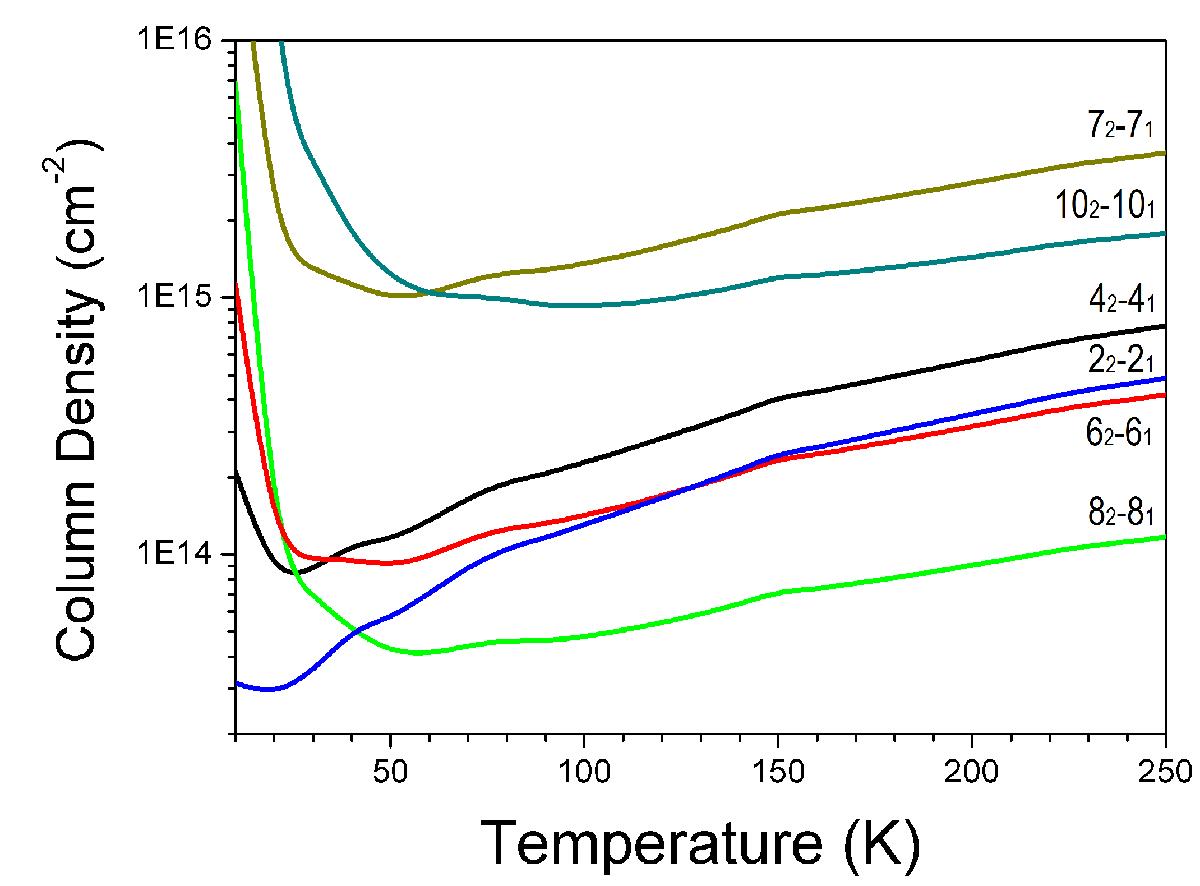
Column densities for the six methylamine transitions plotted versus temperature. This plot is made for a 3σ limit of 0.1 K km s-1, as found for W3(H2O). This figure demonstrates that the 82 − 81 transition (green) gives the most sensitive limits on column density for the relevant range of excitation temperatures in hot cores, when observed. The other five transitions (42→ 41, black; 72→ 71, gold; 102→ 101, cyan; 22→ 21, blue and 62→ 61, red) clearly imply higher column densities. Only below 40 K does the 22→ 21 line give lower column density limits.
Current usage metrics show cumulative count of Article Views (full-text article views including HTML views, PDF and ePub downloads, according to the available data) and Abstracts Views on Vision4Press platform.
Data correspond to usage on the plateform after 2015. The current usage metrics is available 48-96 hours after online publication and is updated daily on week days.
Initial download of the metrics may take a while.