Fig. 1
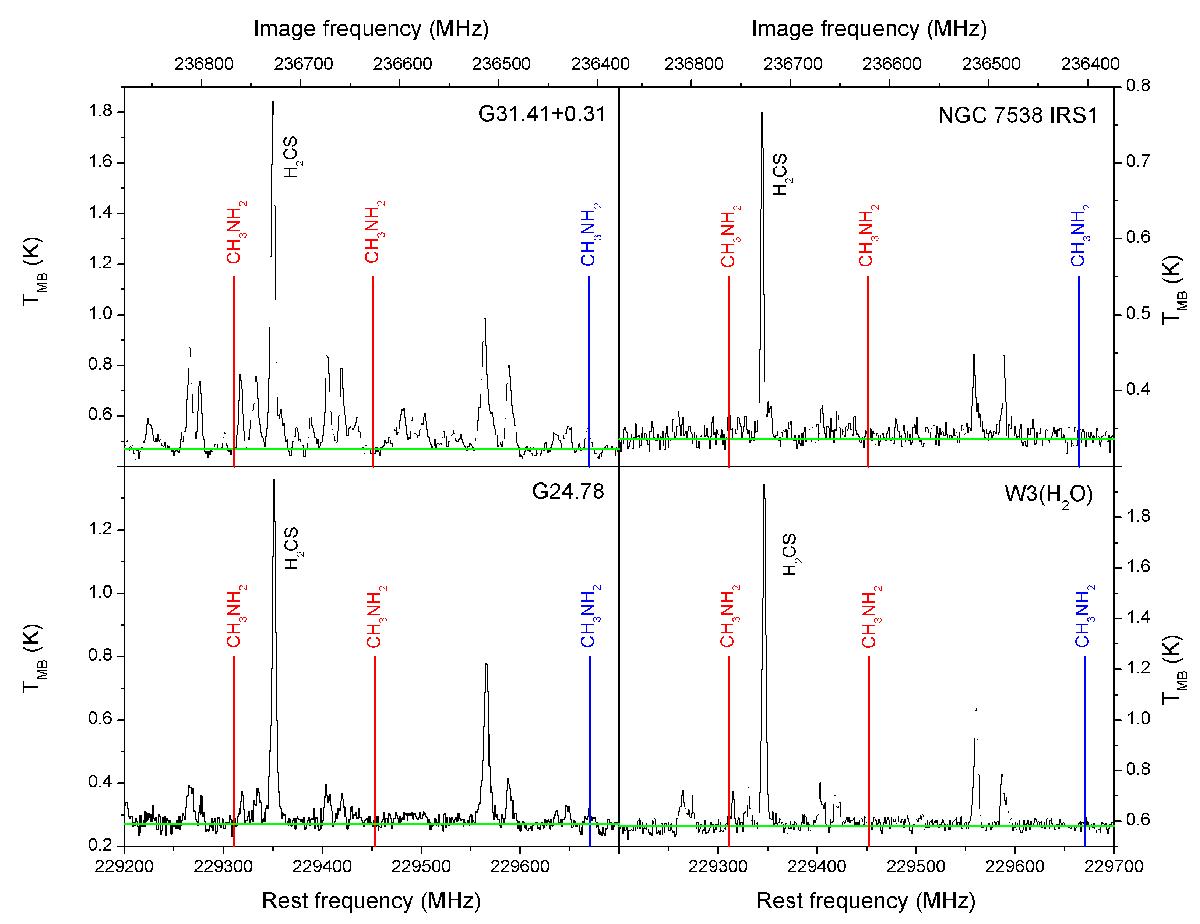
JCMT spectra of the massive hot cores G31.41+0.31, G24.75, NGC 7538 IRS1 and W3(H2O). The 229 310 and 229 452 MHz transitions in the lower sideband are indicated in red and that at 236 408 MHz in the upper sideband in blue. In green is the baseline, obtained by fitting line free portions of the spectrum. In all spectra the H2CS 71 → 61 transition at 236 726 MHz is fitted to determine the typical linewidth in the sources, as listed in Table 1.
Current usage metrics show cumulative count of Article Views (full-text article views including HTML views, PDF and ePub downloads, according to the available data) and Abstracts Views on Vision4Press platform.
Data correspond to usage on the plateform after 2015. The current usage metrics is available 48-96 hours after online publication and is updated daily on week days.
Initial download of the metrics may take a while.