Fig. 7
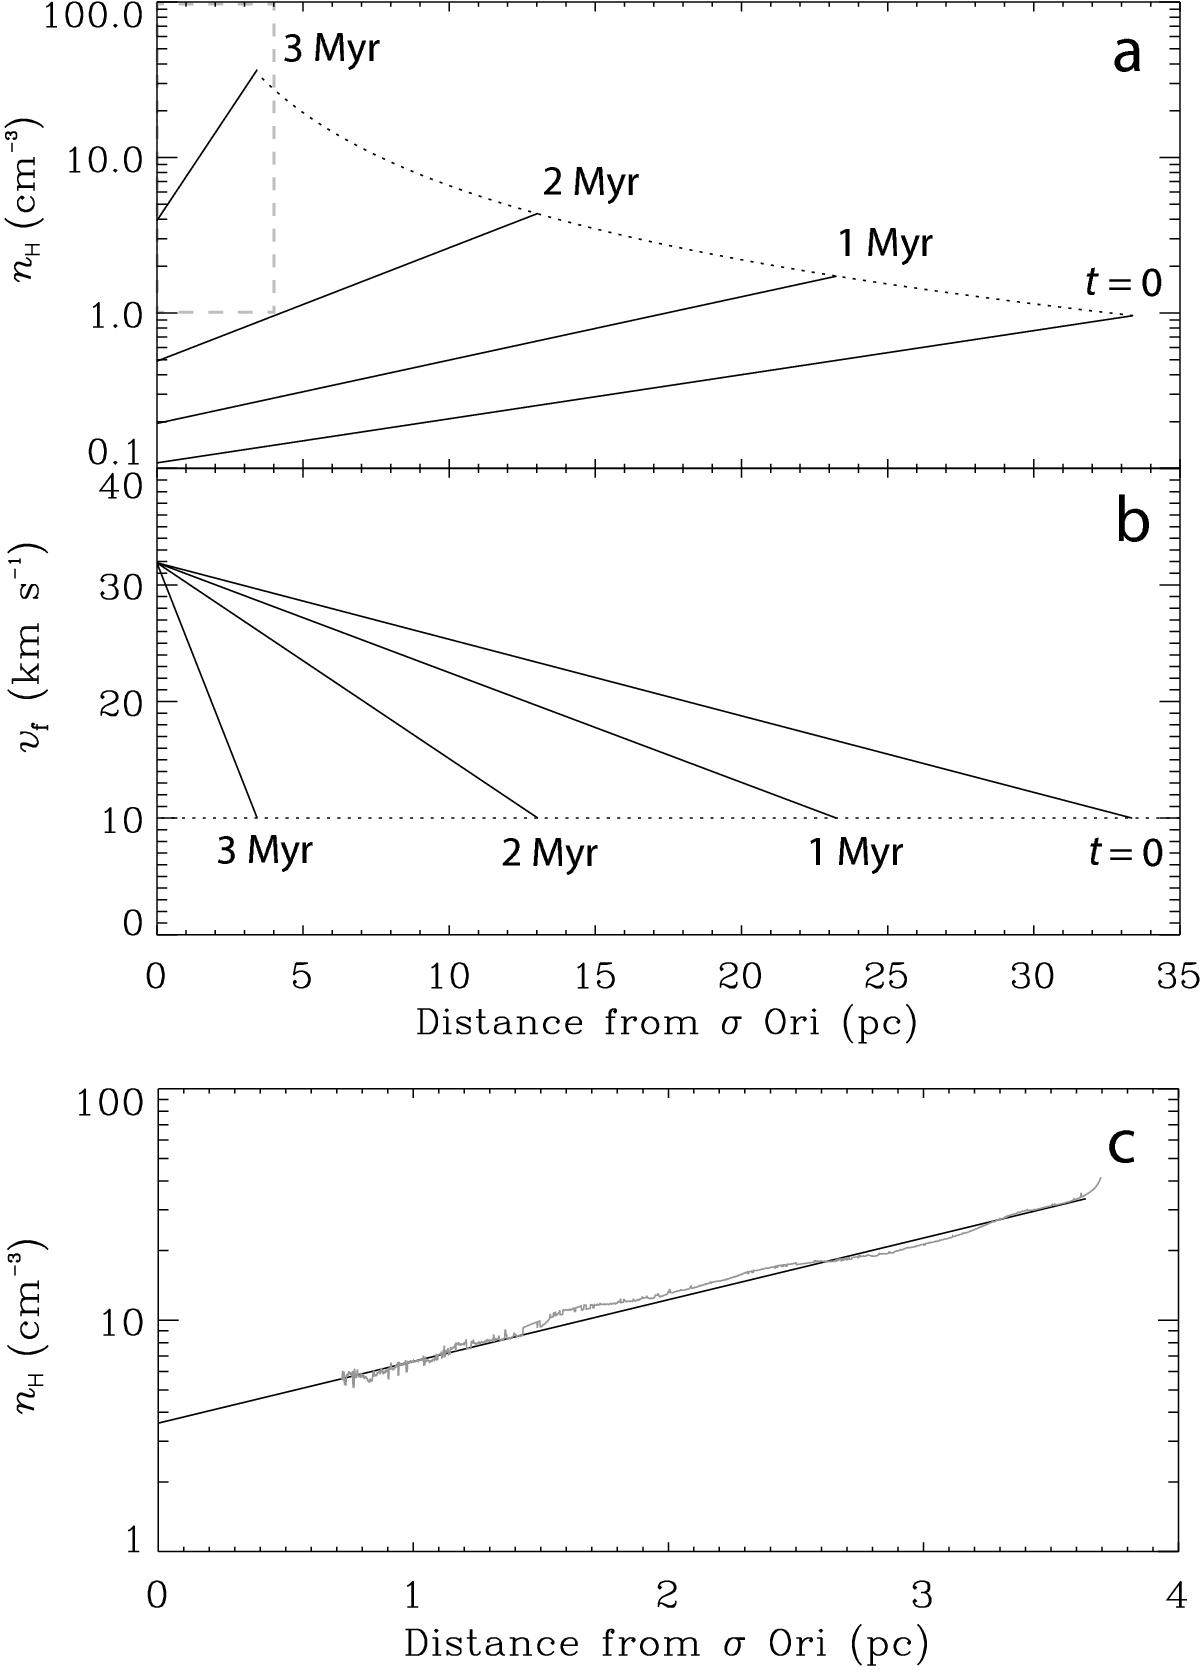
a) Density structure n of the champagne flow as σ Ori moves toward the cloud (Sect. 3.3). The different curves represent the density structure after time t: 0 Myr, 1 Myr, 2 Myr, and 3 Myr. The dotted line shows the evolution of the density at the IF, n0. The gray dashed box shows the outline of the region of panel c). b) Velocity structure of the flow. To transform this to the frame between star and cloud, one has to add the relative velocity between the star and cloud, v⋆ = 10 km s-1. c) Density profile at t = 3 Myr, overplotted with the observed density profile from the Hα emission measure, assuming a constant scale size of the emitting gas along the line of sight of l = 9 pc (see text).
Current usage metrics show cumulative count of Article Views (full-text article views including HTML views, PDF and ePub downloads, according to the available data) and Abstracts Views on Vision4Press platform.
Data correspond to usage on the plateform after 2015. The current usage metrics is available 48-96 hours after online publication and is updated daily on week days.
Initial download of the metrics may take a while.