Fig. 6
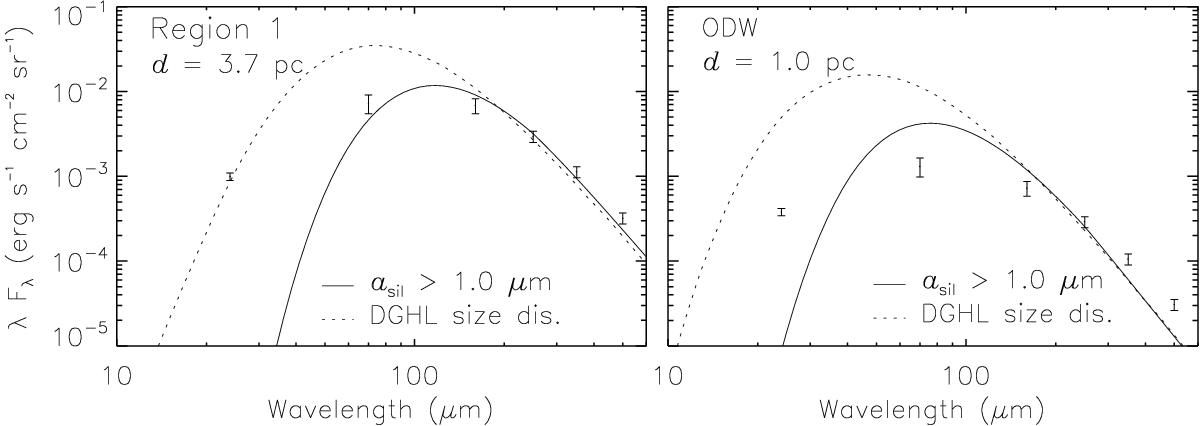
Modeling of the far-IR SED using DUSTEM (Compiègne et al. 2011). Two panels are shown, corresponding to two different regions (Fig. 4). Left panel: region 1 (d = 3.7 pc); right panel: outer dust wave region (ODW; d = 1 pc). Overplotted is the predicted dust emission for two different composition and size distribution of grains (see text).
Current usage metrics show cumulative count of Article Views (full-text article views including HTML views, PDF and ePub downloads, according to the available data) and Abstracts Views on Vision4Press platform.
Data correspond to usage on the plateform after 2015. The current usage metrics is available 48-96 hours after online publication and is updated daily on week days.
Initial download of the metrics may take a while.