Fig. 5
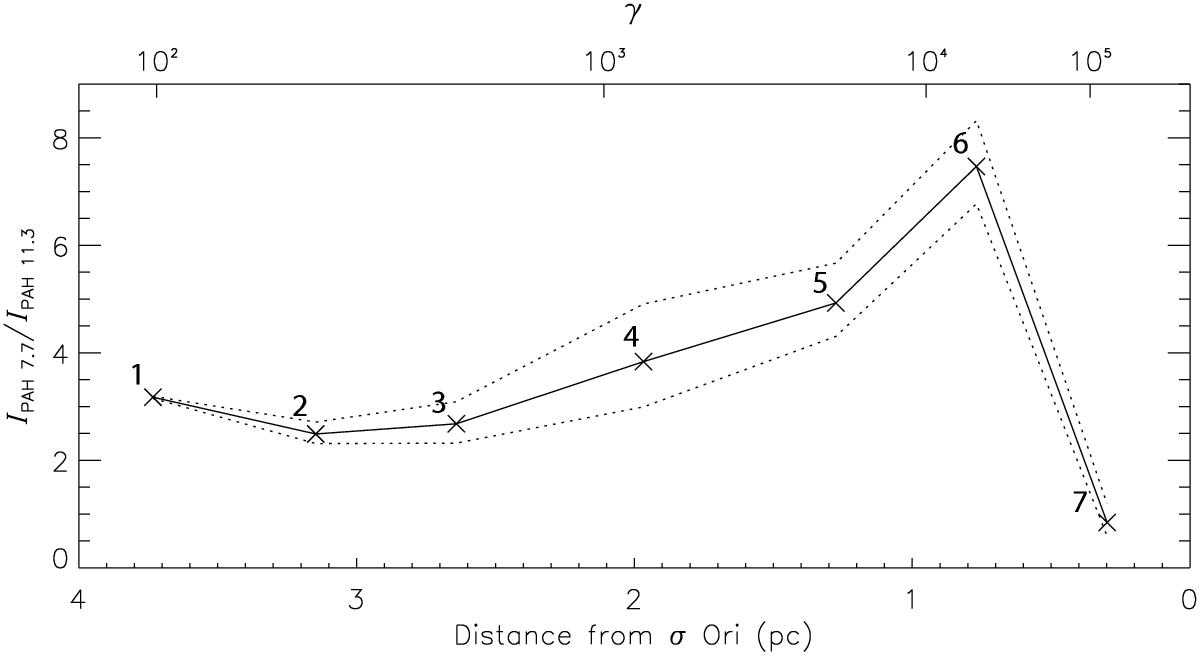
Evolution of the PAH 7.7 μm over 11.3 μm intensity ratio as a function of distance into the H ii region, tracing the ionization state of the PAH molecules (e.g. Bauschlicher 2002; Szczepanski & Vala 1993). The intensities of the bands are measured with PAHFIT (Smith et al. 2007). The ratio shows a systematic rise with distance into the H ii region, indicating that the molecules reside within the ionized gas, and a dramatic drop in the region closest to the ionizing star. The numbers correspond to the regions drawn in Fig. 4; the dotted lines show the 1σ uncertainty constrained by the quality of the spectra. The upper axis plots the ionization parameter γ (Tielens 2005).
Current usage metrics show cumulative count of Article Views (full-text article views including HTML views, PDF and ePub downloads, according to the available data) and Abstracts Views on Vision4Press platform.
Data correspond to usage on the plateform after 2015. The current usage metrics is available 48-96 hours after online publication and is updated daily on week days.
Initial download of the metrics may take a while.