Fig. 4
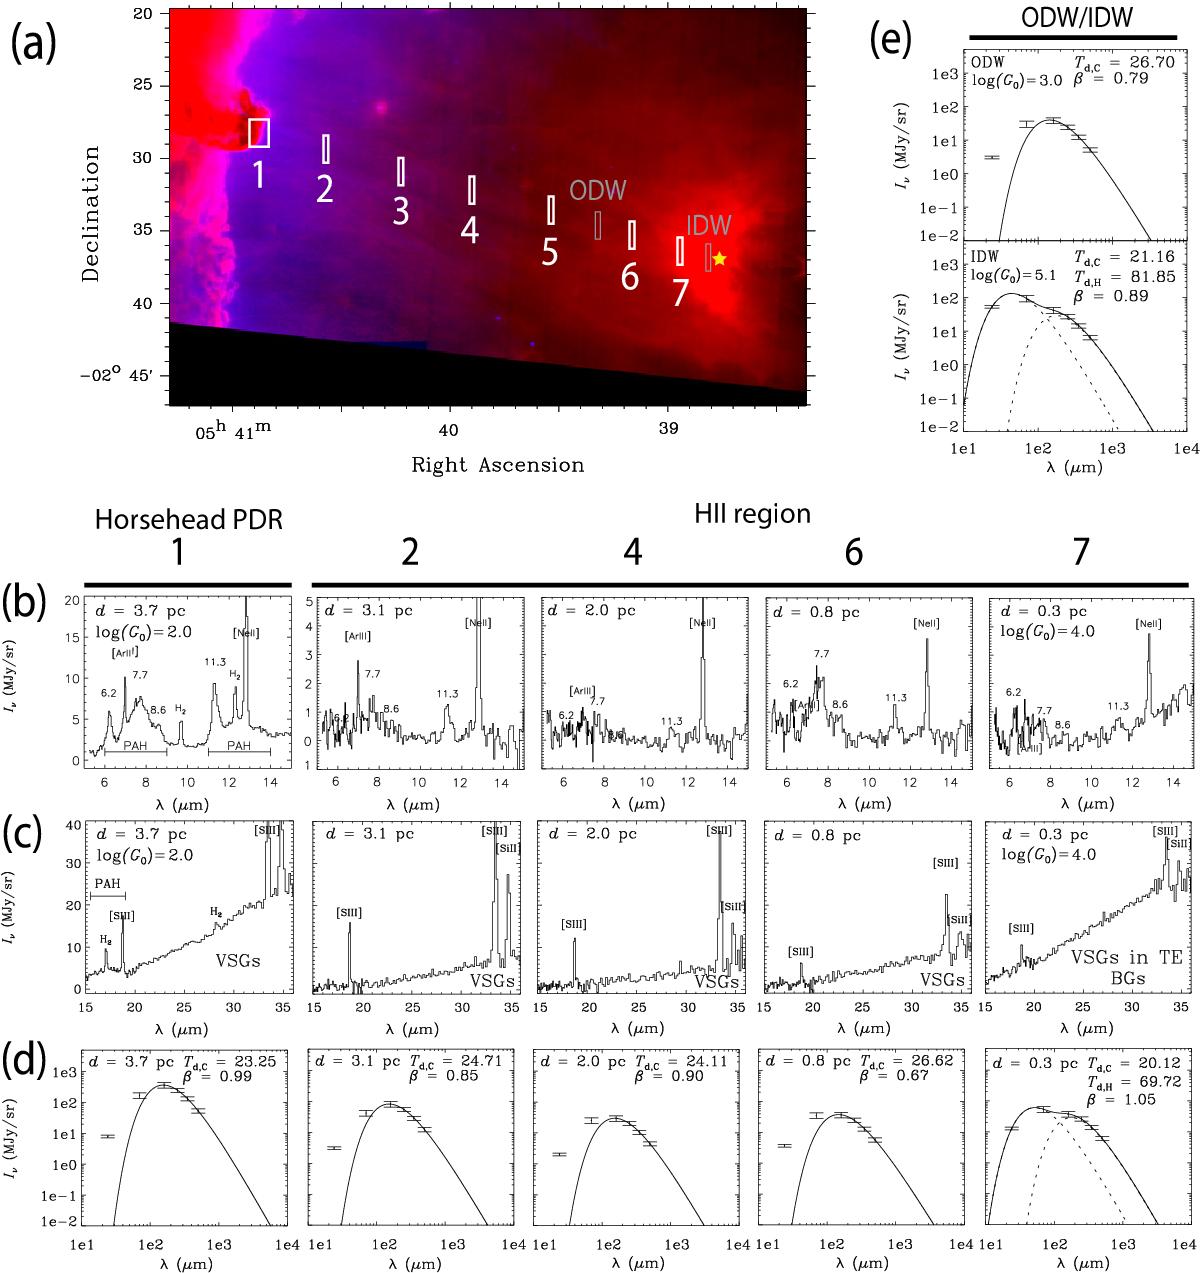
a) Mid-IR view of the Horsehead – σ Ori AB (yellow asterisk) region. Red is MIPS 24 μm, blue is Hα from the KPNO 4.0 m Mayall telescope. Overplotted in white rectangles are the regions for which Spitzer IRS/spectra and SEDs were extracted. The gray rectangles are the location of the peak intensities of the outer dust wave (ODW) and inner dust wave (IDW) for which only the SED is available. b) From left to right, Spitzer/IRS SL spectra at a distance d = 3.7 pc (located partly inside the Horsehead PDR), 3.1 pc, 2.0 pc, 0.8 pc (inside the H ii region) and 0.3 pc (projected on top of IDW) from σ Ori AB are extracted, where d is the distance along a straight line connecting σ Ori AB and the Horsehead. Indicated are gas emission lines, the PAH plateau at 6–9 μm and at 11–14 μm, and the incident radiation field G0. PAH emission is clearly observed throughout the H ii region. c) Same as b), but for the IRS LL modules. Labeled beneath the curve is the source of the rising continuum in the mid-IR. d) Far-IR SED of the regions. In all cases except for region 7, a single-component fit is conducted on the SED, as VSGs emit significantly at λ ≤ 70 μm. In region 7, we assume thermal equilibrium for the warm component and add a second component to the fit. e) SEDs for the ODW and IDW.
Current usage metrics show cumulative count of Article Views (full-text article views including HTML views, PDF and ePub downloads, according to the available data) and Abstracts Views on Vision4Press platform.
Data correspond to usage on the plateform after 2015. The current usage metrics is available 48-96 hours after online publication and is updated daily on week days.
Initial download of the metrics may take a while.