Fig. 3
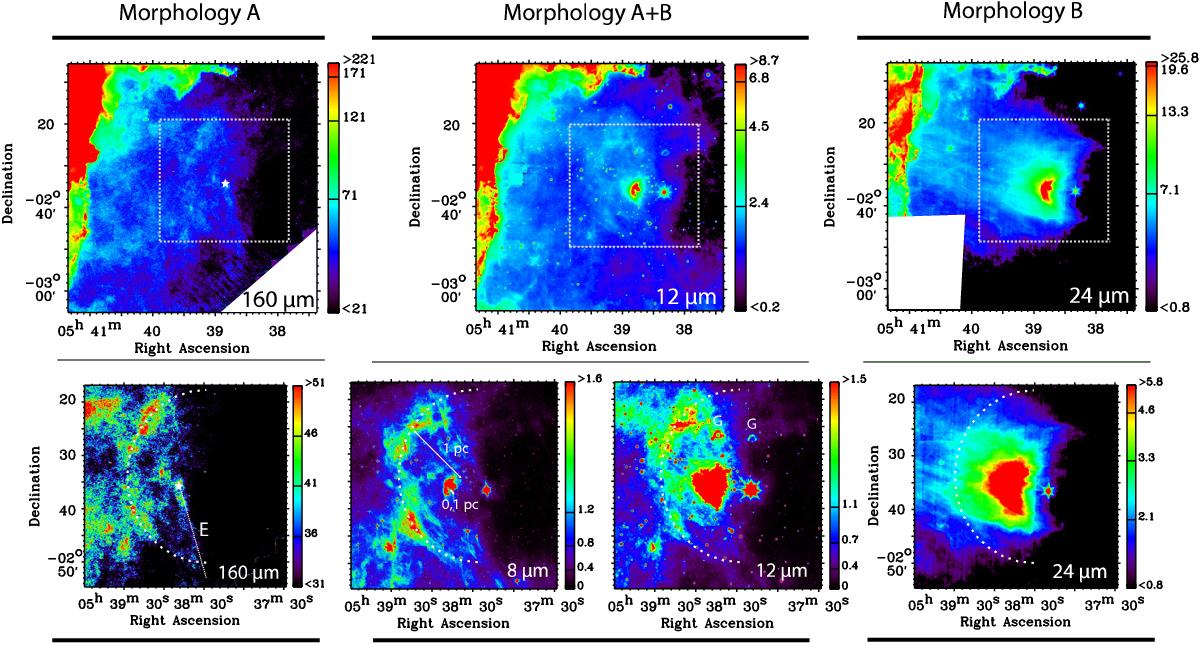
Two different infrared morphologies within IC 434. In all panels: north is up, east is to the left. Morphology A is evident at every wavelength except for 24 μm, and shows a diffuse structure emanating from the entire L1630 molecular cloud. Morphology B is a relative narrow structure, ranging from the L1630 molecular cloud towards σ Ori AB (white asterisk in the 160 μm images), where it interacts with radiation pressure from the star at projected distance 0.1 <d ≲ 0.4 pc (Paper I), forming the inner dust wave that is visible at wavelengths λ< 24 μm. The 8 μm and 12 μm images show a combination of both morphologies (A+B). The lower panels zoom into the direct surroundings of σ Ori AB and cover the region in the dotted white box seen in the upper panels. The 8 μm, 12 μm and 160 μm images show another arc-like structure at a distance of ~1 pc away from the star (dashed line), forming the outer dust wave. The 12 μm suffer from several ghost features (“G”). The 160 μm image reveals an extended collimated flow (dotted line) away from the σ Ori AB, not seen at 8 μm and 12 μm, which is possibly an evaporating member (“E”) of the large σ Ori cluster. The color bars show the brightness scale in units of MJy/sr.
Current usage metrics show cumulative count of Article Views (full-text article views including HTML views, PDF and ePub downloads, according to the available data) and Abstracts Views on Vision4Press platform.
Data correspond to usage on the plateform after 2015. The current usage metrics is available 48-96 hours after online publication and is updated daily on week days.
Initial download of the metrics may take a while.