| Issue |
A&A
Volume 576, April 2015
|
|
|---|---|---|
| Article Number | A119 | |
| Number of page(s) | 24 | |
| Section | Catalogs and data | |
| DOI | https://doi.org/10.1051/0004-6361/201424709 | |
| Published online | 16 April 2015 | |
SALT observations of southern post-novae⋆,⋆⋆
Centre for Astronomy, Faculty of Physics, Astronomy and Informatics, Nicolaus Copernicus University, Grudziadzka 5, 87-100 Torun, Poland
e-mail: tomtom@astri.umk.pl
Received: 30 July 2014
Accepted: 15 January 2015
Aims. We report on recent optical observations of the stellar and the nebular remnants of 22 southern post-novae.
Methods. In this study, for each of our targets, we obtained and analysed long-slit spectra in the spectral range 3500–6600 Å and in Hα+[N ii] narrow-band images.
Results. The changes in the emission lines’ equivalent widths with the time since the outburst agree with earlier published results of other authors. We estimated an average value α = 2.37 for the exponent of the power law fitted to the post-novae continua. Our observations clearly show the two-component structure of the V842 Cen expanding nebulae, owing to the different velocities of the ejected matter. We discovered an expanding shell around V382 Vel with an outer diameter of about 12″.
Key words: novae, cataclysmic variables
The spectra as FITS files are only available at the CDS via anonymous ftp to cdsarc.u-strasbg.fr (130.79.128.5) or via http://cdsarc.u-strasbg.fr/viz-bin/qcat?J/A+A/576/A119
© ESO, 2015
1. Introduction
Classical novae are cataclysmic variable (CV) systems in which a thermonuclear runaway occurs on the surface of a white dwarf accreting matter from a red dwarf companion. Exceptions are several recurrent novae in which the donor star is a red giant. Now it is generally accepted that the classical nova eruptions are also recurrent events but with much longer recurrent times >103 yr (Shara et al. 2012b). Because of its transient character, the nova phenomenon attracts the observers’ attention mainly during the eruption. Consequently, the vast majority of the novae observational data is collected during the outburst. Remarkably less data is secured for the post-outburst phase, when the star is approaching its quiescence brightness and during the subsequent years and decades. Of course, the scarcest observational data were collected for the time before the nova explosions.
During recent years, classical nova shells were discovered around two dwarf novae, Z Cam and AT Cnc (Shara et al. 2007, 2012a). These shells are observational evidence that at least some dwarf novae have undergone classical nova eruptions. Johnson et al. (2014) suggest that the observed fading of V603 Aql confirms the prediction of the hibernation hypothesis (see, for instance, Shara et al. 1986) that old novae should be fading significantly in the century after their eruption is over. Patterson et al. (2013) report a transition from nova-like to dwarf nova for BK Lyn, the possible remnant of the possible classical nova Nova Lyn 101. But, a crucial example that confirms the hibernation hypothesis, an old nova in hibernation state, is still missing. Detailed studies of as many old novae as possible are needed to expand our knowledge of the nova systems, the individual components and their evolution as CVs.
Most old novae are rather faint and difficult to observe. Because of this, only a small fraction among the known ~340 Galactic novae (Downes et al. 2006) have been studied in detail at quiescence. For most of the old novae, photometric and spectroscopic observations in quiescence are missing. Many of them are ambiguously identified, and in the catalogue of Downes et al. (2006), only the field where they should be located is marked.
Attempts to survey the stellar and nebular novae remnants, among others, were made by Williams (1983), Duerbeck & Seitter (1987), Ringwald et al. (1996), Gill & O’Brien (1998, 2000), and Downes & Duerbeck (2000). Recently, Tappert et al. (2012, 2013, and references therein) have started a program to identify, confirm spectroscopically, and determine the orbital periods of a large number of old novae, whose explosions took place before 1980.
In this paper we present long-slit spectroscopy and Hα+[N ii] narrow-band imaging survey of 22 southern novae remnants. Our targets were selected from the Downes et al. (2006) catalogue of CVs among the well-identified old novae.
Summary of SALT observations.
2. Observations and data reduction
The observations were obtained at the SAAO Observatory with the Robert Stobie Spectrograph (RSS; Burgh et al. 2003; Kobulnicky et al. 2003) and the 10 m Southern African Large Telescope (SALT; Buckley et al. 2006; O’Donoghue et al. 2006). The narrow-band imaging and the long-slit spectroscopy modes of the RSS were used. The diameter of the RSS effective field of view is 8 arcmin. We applied a binning factor of 2, which gives a spatial resolution of 0.254 arcsec pixel-1. In the RSS narrow-band imaging mode, we used a Fabry-Perot interference filter pi06530, centred close to Hα + [N ii] at 6530 Å and with a full width at half maximum FWHM = 156 Å. In the RSS long-slit spectroscopy mode, the volume phase holographic (VPH) grating PG0900 was used in the spectral range 3500−6600 Å. The slit width was 1.̋5, which gives a reciprocal dispersion of ~0.98 Å pixel-1 and a resolving power ~800. Spectra of ThAr, Ar, and Xe comparison arcs were obtained to calibrate the wavelength scale. For relative flux calibration, we used spectra of the spectrophotometric standard stars Hilt 600, EG 21, and LTT 4364, obtained in the default calibration framework. A summary of our observations is provided in Table 1.
The RSS detector is a three-CCD-chip mosaic. The first observations revealed that our attempt to find an optimal positioning of the spectrum on the CCD mosaic using PIPT (Principal Investigator Proposal Tool, Hettlage et al. 2010) was not very successful. It turned out that the Hα line is located at the very edge of the chip (see Figs. 1 and 10). To avoid problems with losing other lines in the gaps between the CCD detectors, we decided to do not change the RSS long-slit setup during the observation semester.
The initial reduction of the data, including bias and overscan subtraction, gain and cross-talk corrections, trimming and mosaicking, was done with the SALT science pipeline (Crawford et al. 2010).
We used the dcr software written by W. Pych. Its algorithm is described in Pych (2004), and it removes the cosmic rays from the long-slit spectral observations. To perform the flat field corrections and the wavelength calibration and to correct the distortion and the tilt of the frames, we used the standard iraf1 tasks in the twodspec package. Most of the nights in which our targets were observed were not photometric. Moreover, SALT is a telescope with a variable pupil, which makes the absolute flux calibration impossible. Because of this we calibrated the spectra in relative flux using an average sensitivity curve, only to derive some info about the relative spectral energy distribution.
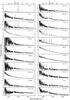 |
Fig. 1 Normalized at 5500 Å flux spectra of the targets. The spectra are dereddened and have been smoothed with a 3 × 3 box filter. The gaps in the spectra reflect the RSS interchip gaps. |
From the Hα+[N ii] narrow-band imaging, we reduced and used the central only 4′ × 4′ field. The data were processed in a standard way, using the appropriate iraf tasks. Because flat field calibration images were not obtained every night, in some cases the task imsurfit was used for a final flattening of the field. The reduced images of each of our targets were combined to improve the signal-to-noise ratio (S/N).
The resulting 1D dereddened (see Sect. 3 and Table 2) spectra are shown in Fig. 1. The Hα+[N ii] narrow-band imaging in a field of 4′ × 4′ around each nova, as well as the extracted spectrum before reddening correction, are presented in Fig. 10. Profiles of individual spectral lines are shown in Figs. 11−19.
The equivalent widths (EW) and the FWHM of the strongest emission lines measured in the target spectra are provided in Table 3. The measurements were done with the iraf task splot fitting Gaussians to the emission lines. The error estimates were computed directly in splot by running a number of Monte Carlo simulations based on preset instrumental parameters.
Interstellar extinction and the slope (F = λ− α) of the continuum.
3. Interstellar extinction and spectral energy distribution (SED)
To get an idea about the SED of the observed old novae, we first corrected their spectra for the interstellar extinction. We searched for published estimations of the extinction AV and/or the colour excess EB − V for the particular novae. The relation AV = 3.1EB − V was used to compare them. In cases where more than one estimation was found, we compared them very carefully, adopting the best one for further use. For two objects, Nova Car 1972 and CN Vel, we did not find any estimations of the interstellar extinction in the literature. For them we adopted the minimum value of the interstellar extinction, corresponding to the direction to these targets (Schlafly & Finkbeiner 2011), taken from NASA’s IPAC Infrared Science Archive (IRSA). The adopted values of EB − V and the corresponding references are presented in Table 2. The spectra were dereddened using the appropriate iraf task and applying the empirical selective extinction function of Cardelli et al. (1989) with RV = 3.1.
The exponents of the power law F = λ− α fitted to the continuum of the dereddened spectra are also shown in Table 2. For all the objects, a single power law was fitted in the wavelength range 4000−6500 Å. The errors of the exponents represent only the standard deviation from the fitted power law. The average value of the exponent α for our sample is 2.25 ± 0.78 (excluding Nova Car 1972, see Sect. 4.11). For the same number of old novae Ringwald et al. (1996) estimated an average α = 2.68 ± 0.82. For a sample of eight post-novae Tappert et al. (2012) found “that α for most systems falls well below the value of 2.33 for a steady-state accretion disk (Lynden-Bell 1969)”. Excluding the objects fitted with two power laws and V529 Ori, which shows an atypical SED, 13 post-novae published by Schmidtobreick et al. (2005c) and Tappert et al. (2012, 2014) remain for which an average α = 2.13 ± 0.67 can be estimated.
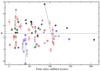 |
Fig. 2 Power law exponents α as a function of the time since outburst. The symbols represent as follows: circles – this paper; diamonds – Ringwald et al. (1996); squares – Tappert et al. (2012); triangles up – Schmidtobreick et al. (2005c); tiangles down – Tappert et al. (2014). The double exponents for V630 Sgr, V842 Cen, V2109 Oph, V604 Aql and V2104 Oph (Schmidtobreick et al. 2005c; Tappert et al. 2012, 2014) are connected with dashed lines. Our exponent for V842 Cen is also connected by a dashed line to the line between its two exponents from Schmidtobreick et al. (2005c). The α values for the only common object in ours and Ringwald et al. (1996) samples, X Ser, are connected with a dashed line as well. The dot-dashed line represents the value α = 2.33 for a steady-state accretion disk. |
In Fig. 2 our power-law exponents, together with these from Ringwald et al. (1996)2, Schmidtobreick et al. (2005c), and Tappert et al. (2012, 2014), are presented as a function of the time since outburst. From the mean values and Fig. 2, it is obvious that most of the Ringwald et al. (1996) power-law exponents are above the steady-state disk exponent, while the majority of the Schmidtobreick et al. (2005c) and Tappert et al. (2012, 2014) exponents are below this value. Our exponents are more or less symmetrically distributed around the steady disk exponent. Nine years after Schmidtobreick et al. (2005c) we estimated a power law exponent for V842 Cenα = 2.90 which is practically the mean of their two values 4.32 and 1.59. Somewhat surprising is the large difference in the exponents of X Ser 4.81 and 1.46 estimated by Ringwald et al. (1996) and by us about 87 and 109 yr, respectively, after its outburst. From one side, this difference could, at least partly, be caused by, as Ringwald et al. (1996) pointed out, may be too high a value of EB − V they used to deredden the spectrum. On the other hand, it is possible that X Ser shows an intrinsic variation of the power law exponent. A remarkable change from α = 0.5 in their 1997 spectrum to α = 1.1 in the spectrum obtained in 1999 was reported by Thorstensen & Taylor (2000).
Excluding the double exponents from Schmidtobreick et al. (2005c) and Tappert et al. (2012, 2014) as well as the X Ser exponent from Ringwald et al. (1996) we estimate an average α = 2.37 ± 0.74, a value very close to that of a steady-state accretion disk.
4. Individual objects
4.1. T Pyx
T Pyx is one of the best studied recurrent novae ever. Leavitt discovered its 1902 outburst on Harvard archival plates in 1913 (Leavitt & Pickering 1913). During a time interval slightly longer than one century, six eruptions of T Pyx were observed, in 1890, 1902, 1920, 1944, 1967, and 2011. The last outburst was excellently covered with systematic observations in the whole electromagnetic wavelength region from X-ray to radio. More details on the previous and the last outbursts of T Pyx can be found in Schaefer (2010a), Schaefer et al. (2013), Shore et al. (2011), Shore et al. (2013), De Gennaro Aquino et al. (2014), Surina et al. (2014), and references therein. An extended shell, different from the other nova shells and composed of many small knots, was discovered by Duerbeck & Seitter (1979). A recent study by Schaefer et al. (2010) sheds new light on the complex shell of T Pyx.
Our RSS spectrum of T Pyx was obtained about 342 days after the outburst of the nova in April 2011. The star was still decreasing from the maximum, and at the moment of our observations its V brightness was between 13 and 14 mag. As seen in Fig. 1, numerous emission lines, some very intensive, are superimposed on a strong blue continuum. The strongest features in the spectrum are the nebular lines of [O iii] 4363 Å, 4959 Å, and 5007 Å. Another relatively strong nebular emission is [N ii] 5755 Å, and a blend of, most probably, [Fe vii] 6084 Å and [Ca v] 6087 Å is apparent as well. In the blue part of the spectrum, the lines of [Ne iii] 3868 Å and 3968 Å are clearly visible. The Balmer emission lines are relatively strong and easily seen up to H8. In the strongest nebular and Balmer emission lines a four component profile structure is obvious. The radial velocities of these components are −1284 ± 82 km s-1, −391 ± 29 km s-1, 329 ± 18 km s-1, and 1128 ± 107 km s-1. These profiles, particularly the [O iii] ones, are very similar to the observed by Shore et al. (2013) in their NOT spectrum of T Pyx obtained on April 8, 2012. Only 4686 Å He ii emission presents in the spectrum with an intensity slightly lower than Hβ and almost equal to that of the closest blend of N iii and C iii emission lines at ~4840 Å (hereafter Bowen blend). From the He i lines, only a very faint emission 5876 Å is visible (Fig. 10). It is interesting to note that Shore et al. (2013) report that in their spectrum of T Pyx, obtained about two weeks after our, He i was not present. A remarkable decrease in the Bowen blend intensity in the April 2012 spectrum of Shore et al. (2013) in comparison to ours is evident, too.
4.2. U Sco
The first outburst of U Sco was discovered by Pogson (1865) in 1863. The recurrent nature of the nova was revealed by Thomas (1940) during a study of archival Harvard patrol plates. U Sco is the fastest known nova with  and at the same time as the recurrent nova with the maximum number of ten observed outbursts. A detailed overview of the historical and the last 2010 outbursts can be found in Schaefer (2010a,b) and references therein. This recurrent nova is a double-lined eclipsing binary with
  (Schaefer & Ringwald 1995), orbital inclination
  , containing a very massive white dwarf MWD = 1.55 M⊙ (Thoroughgood et al. 2001).
Two years after the last outburst, U Sco practically returned to its inter-outburst state. In Fig. 1 it can be seen that a relatively strong, not very steep hot continuum is dominating the spectrum. The strongest emission line is He ii 4686 Å. The only two additional, remarkably weaker emission features that can be identified in the spectrum are Hα and He ii 5412 Å.
4.3. V445 Pup
V445 Pup is an unusual classical nova discovered at the very end of 2000 by Kanatsu (Kato et al. 2000). Ashok & Banerjee (2003) argue that the outburst and the peak brightness occurred between September 26 and November 23, 2000. Based mainly on the hydrogen deficiency and the He/C enrichment in the optical and the IR spectra of V445 Pup, Ashok & Banerjee (2003) supposed that it is a helium nova. Modelling its light curve, Kato & Hachisu (2003) and Kato et al. (2008) present arguments for it being a helium nova on a very massive white dwarf. Woudt et al. (2009a) discovered an expanding bipolar shell and estimated a distance to V445 Pup of 8.2 kpc. Studying the V445 Pup progenitor on archive plates, Goranskij et al. (2010) conclude that it was a common-envelope binary with SED similar to that of an A0V type star. They suggest that the outburst was caused by a helium flash on the surface of a CO-type white dwarf leading to the lost of the common-envelope system.
In the spectrum of V445 Pup, shown in Fig. 1, a weak continuum is seen, remarkably increasing in the blue. The only line features visible in the spectrum are the nebular lines of [O iii] at 4959 Å and 5007 Å. A two-component structure is very visible in both emissions with the red component more than twice weaker (Table 3). The measured radial velocities of the components are −619 ± 8 km s-1 and 592 ± 22 km s-1, respectively. Our spectrum with the slit PA = 0° covers, only the central 1.̋5 of the expanding bipolar shell, whose axis lies along a PA ~ 66°, discovered by Woudt et al. (2009a).
4.4. V382 Vel
One of the brightest novae ever observed in the southern skies, V382 Vel was discovered by P. Williams and A. Gilmore (Williams et al. 1999). It is a fast nova (t3 ~ 9d) that reached maximum brightness  on 23 May 1999 (Della Valle et al. 2002). It was found that V382 Vel is a ONeMg nova (Woodward et al. 1999) very similar to V1974 Cygni (Shore et al. 2003). An orbital period of 3
 5 was detected by Balman et al. (2006). Downen et al. (2013) estimate the white dwarf mass to be about 1.2 M⊙. Despite the very high expansion velocity ~3000−5000 km s-1 and the relatively short distance of about 2 kpc (Della Valle et al. 2002; Shore et al. 2003), observations of an extended shell around V382 Vel were missing in the literature. In this paper we present the first detection of the V382 Vel expanding shell (see Sect. 6).
To our knowledge, the spectrum of V382 Vel in Fig. 1 is the first quiescence spectrum presented after its outburst. It is characterized by a strong and steep blue continuum and by numerous superimposed emission lines. Among the strongest emission features are the Balmer lines, which are very visible up to H11, as well as many He i lines, the Bowen blend, and the He ii 4686 Å line (see Table 3). Also seen well is the line C iv 5805 Å. The only evidence of a significant contribution of emission from the expanding shell is the multicomponent profile of the Hα + [N ii] blend (see also Schmidtobreick et al. 2012).
4.5. CP Cru
CP Cru is a nova probably with a missed maximum brightness, which was discovered by W. Liller on August 26, 1996 (Liller et al. 1996). It is a fast nova with t2 ~ 4d and an extended shell discovered in a relatively short time after the outburst (Downes & Duerbeck 2000). From the expansion parallax Downes & Duerbeck (2000) derived a 3.2 kpc distance to CP Cru, corrected later to 2.6 ± 0.5 kpc by Lyke et al. (2003). Woudt & Warner (2003) found that CP Cru is an eclipsing binary with  and orbital inclination ~70°.
A hot, steeper in the blue continuum dominates in the quiescence spectrum of CP Cru (Fig. 1). Because of the low S/N of our spectrum, weak Hα and He ii 4686 Å are the only emission features that could be identified with some certainty.
4.6. BY Cir
BY Cir is a slow nova with t3 ~ 124d (Strope et al. 2010) discovered on January 27, 1995 (Liller et al. 1995a). The observations of Downes & Duerbeck (2000) did not resolve an extended shell around BY Cir, but the authors noted that the remnant is too young. Woudt & Warner (2003) found that BY Cir is an eclipsing binary with  , which belongs to the group of the long-period, deeply eclipsing nova remnants.
There is no spectrum of the BY Cir remnant published before the one we show in Fig. 1. The hot continuum is relatively weak and not so steep in the blue. Only Hα and Hβ are visible in the spectrum. Very weak emissions of He ii 4686 Å, Bowen blend, and [O iii] 5007 Å are also present in the spectrum. The nebular [O iii] line and the multicomponent Hα profile could be evidence that the emission from the expanding shell is still significant. It is noticeable that the Hβ emission line also shows a clear triple structure, with component velocities on the order of −950 km s-1, −300 km s-1, and 750 km s-1.
4.7. V888 Cen
Another nova discovered by Liller in February 1995 is V888 Cen (Liller et al. 1995b). Analysing its light curve and spectra, Yan Tse et al. (2001) found that V888 Cen is a very fast nova with t3 ~ 12d and estimated the nova distance to about 7.4 kpc. Downes & Duerbeck (2000) failed to reveal an extended shell around this nova.
The RSS spectrum of V888 Cen presented in Fig. 1 reveals a not very steep hot continuum with only a relatively weak Hα and possible, also weak, Bowen blend emissions superimposed. Schmidtobreick et al. (2005b) obtained “the first spectrum of V888 Cen in quiescence” nine years after the outburst. In their spectrum, faint emission lines of Hα, Hβ, and Hγ, as well as He ii 4686 Å and the Bowen blend, were presented. The higher Balmer series lines were instead seen in absorption. Our spectrum differs remarkably from that of Schmidtobreick et al. (2005b) because of its low quality. From our S/N we get an upper limit for the EW of not identified lines EW< 5 Å.
4.8. V868 Cen
V868 Cen was discovered by Liller on April 2, 1991 (Liller & Hamuy 1991). Because of the unknown exact moment of maximum brightness, many different decline rates are published. Williams et al. (2003) derived an average t3 = 70 ± 15 days and classified V868 Cen as a medium-fast nova. Downes & Duerbeck (2000) did not find any extended shell around this nova.
Figure 1 presents the spectrum of the remnant of nova V868 Cen obtained about 22 yr after the outburst. Except the hot continuum only Hα is seen in emission. The multicomponent Hα profile indicates a possible contribution by the Hα + [N ii] expanding shell emission.
4.9. V842 Cen
The nova was discovered by McNaught on November 22, 1986 (McNaught et al. 1986). Whitelock (1987) classified V842 Cen as a moderately fast nova, based on the estimated t3 ~ 48d. The nova extended shell was revealed by Gill & O’Brien (1998) and observed again three years later by Downes & Duerbeck (2000). We detected the extending shell around V842 Cen in both the Hα+[N ii] narrow-band images and the long-slit spectra, and the details are presented in Sect. 6. Schmidtobreick et al. (2005c) show the spectrum of the remnant obtained in 2003. Woudt et al. (2009b) estimated the orbital period of V842 Cen to 394 and the white dwarf rotation period to ~57 s. They suggest that V842 Cen is an intermediate polar with “the fastest rotating white dwarf among the intermediate polars and the third fastest known in a cataclysmic variable”. A recent multiwavelength photometry and HST spectroscopy study (Sion et al. 2013) has revealed some problems with the intermediate polar interpretation of V842 Cen.
Our spectrum of V842 Cen obtained about 26 yr after the nova outburst can be compared to the spectrum obtained by Schmidtobreick et al. (2005c) nine years earlier (Fig. 1 and Table 3). An obvious difference is that the hot continuum in our spectrum is not very steep in the blue. Comparing the plotted spectra, the EW, and the FWHM, it looks like the Balmer and the He i emission lines remain more or less the same. Some higher excitation emissions like C iv 5805 Å and He ii 5412 Å are not visible in our spectrum. Other such emissions, for example, He ii 4686 Å and the Bowen blend are significantly fainter than nine years ago. The multicomponent structure of Hα testifies that the [N ii] emission from the expanded shell continue to be significant. Also, the [O iii] 5007 Å nebular emission (not He i as identified this feature Schmidtobreick et al. 2005c) is still seen clearly in the spectrum.
4.10. GQ Mus
Liller discovered this nova on January 18, 1983 (Liller & Overbeek 1983). GQ Mus was classified as a moderately fast nova with t3 ~ 45d (Duerbeck 1987a). The most important observations after the outburst in a wide wavelength range are listed in Duerbeck (1987a). An orbital period of 85 min, confirmed by time-resolved photometry and spectroscopy, was found by Diaz & Steiner (1989, 1990, 1994). They also suggested that the outbursting component in GQ Mus is a magnetic white dwarf. The nova is a known super soft X-ray source (Schwarz et al. 2011, and references therein). Hachisu et al. (2008) estimate the mass of the white dwarf in the system to be 0.7 ± 0.05 M⊙. A spectrum of the remnant, obtained in 1994, is shown by Diaz et al. (1995). Attempts by Gill & O’Brien (1998) and Downes & Duerbeck (2000) failed to detect an extended shell around GQ Mus.
A comparison of the spectrum of GQ Mus in Fig. 1 to the one obtained in 1994 by Diaz et al. (1995) shows that, most probably, ours is the first really quiescence spectrum observed. Their spectrum is very rich in emission features, mainly Balmer and nebular lines, while in our spectrum a weak Hα and maybe only a trace of the He ii 4686 Å emissions can be seen. The flat top of the Hα profile suggests that the contribution of the [N ii] shell emission could still be significant. A hot continuum, which is steeper in the blue, is also evident.
Recently, Narloch et al. (2014) have found that the total amplitude of the GQ Mus orbital modulation brightness decreased from ~ in 1992 to ~
 in 2010. In the same time period, they found no evidence of period changes between 1989 and 2011. The optical spectrum obtained in 2001 and ours obtained in 2012 indicate continuing activity of GQ Mus.
4.11. Nova Car 1972
Nova Car 1972 has been a questionable object even since its discovery. It was communicated as a possible nova even by its discoverers (MacConnell et al. 1978). Duerbeck (1987a) mentioned it as a poorly known nova. In a later attempt, Downes & Duerbeck (2000) were not able to find a Hα-bright candidate and expressed doubts about the reality of Nova Car 1972.
It looks like there is a very weak blue continuum in the spectrum of Nova Car 1972 (Fig. 1). But this spectrum is dereddened when using a relatively large  , corresponding to the Galactic coordinates of the object (Schlafly & Finkbeiner 2011, NASA’s IPAC Infrared Science Archive, see Sect. 3 and Table 2). The originally extracted, not reddening-corrected spectrum (Fig. 10) indicates a rather very weak and red continuum. There are no emission lines in the spectrum. We agree with the suggestion of Downes & Duerbeck (2000) about the reality of this object, and our conclusion is that Nova Car 1972 is not a nova.
4.12. HS Pup
HS Pup reached a maximum brightness of ~8m in December 1963 (Huth & Hoffmeister 1964) but was discovered in February 1964 (Strohmeier 1964). Duerbeck (1987a) classified it as a moderately fast nova (t3 ~ 65d) with no spectroscopic observation available. The first quiescent spectra of the star were obtained by Bianchini et al. (1991, 1992), but they published only an extremely short description. The last one, reported in the literature, was obtained by Zwitter & Munari (1995) several years later. An extended shell with a diameter <2.̋5 was found around HS Pup by Gill & O’Brien (1998) but they were not able to estimate the distance because of the unknown expansion velocity. Woudt & Warner (2010) studied the rapid variations in the star brightness and suggest a tentative orbital period of 3244.
Recently, Tappert et al. (2013) published a better quality spectrum of HS Pup obtained in 2009. The Balmer emission lines and several He i lines are visible. They estimate that the continuum corresponds to an early-to-mid K star. Based on an analysis of the radial velocities, they suggest an orbital period for HS Pup .
.
A relatively weak continuum, increasing toward the blue, is obvious in our spectrum of HS Pup (Fig. 1). The only line that can be definitely identified, is a comparatively strong Hα emission. The spectrum obtained in 1994 and shown by Zwitter & Munari (1995) is very similar to ours with also only Hα emission apparent. This does not exclude the presence of other lines in the HS Pup spectrum as the low S/N gives an upper limit for the equivalent width of unidentified lines <11 Å.
4.13. HZ Pup
HZ Pup was discovered on Sonneberg archive plates by Hoffmeister (1964) after its maximum brightness ~7 7 occurred around January 20, 1963. Low-resolution spectra of the remnant were obtained by Bianchini et al. (1991, 1992) and Zwitter & Munari (1995). Abbott & Shafter (1997) suggested that HZ Pup is an intermediate polar with a spin period of the magnetic white dwarf ~13 min and
  . The observations of Gill & O’Brien (1998) did not show an extended shell around HZ Pup remnant.
A comparison of our RSS observations presented in Fig. 1 with the published by Bianchini et al. (1991, 1992) and Zwitter & Munari (1995) shows that the spectrum of HZ Pup remained more or less the same during the last 22 yr. It is characterized by a strong blue continuum and numerous emission lines. All stronger lines of H i, He i, and He ii are visible in emission (Table 3). Whereas the intensities of Hβ and He ii 4686 Å are almost identical in ours and Zwitter & Munari (1995) spectra, in the spectrum of Bianchini et al. (1991), Hβ is significantly stronger. The hump seen in the continuum in the region ~4200−5200 Å is artificial, most probably caused by a very bright star in the slit at about 2′ to the north of HZ Pup. Our attempts to remove this hump during the data processing proved unsuccessful.
4.14. V365 Car
This nova was first detected as a Hα emission-line object by Henize (1967). Years later it was recognized by Henize & Liller (1975) as a very slow nova with t3> 530d (Duerbeck 1987a). Henize & Liller (1975) estimated the distance to V365 Car to 3.5 ± 1 kpc and found an upper limit for the ejection velocity of about 300 km s-1. The remnant spectrum was only observed by Zwitter & Munari (1996). Two attempts by Gill & O’Brien (1998) and Downes & Duerbeck (2000) to detect an extended shell around V365 Car were unsuccessful. Woudt & Warner (2002) found slow flickering in their time-resolved photometry of V365 Car, but they were not able to detect any orbital period. Tappert et al. (2013) show an average of their spectra obtained during 2011 and 2012 in the region ~6200 − 7100 Å. They only mention the presence of relatively weak Hα and He i 6678 Å emissions. Based on the brightness and radial velocity variations, they suggest an orbital period for V365 CarPorb of ~ .
.
A blue continuum, similar to the observed by Zwitter & Munari (1996) in 1995 is apparent in our spectrum of V365 Car shown in Fig. 1. A very weak Hα emission presents also in the spectrum but mentioned by Zwitter & Munari (1996) Hβ and He ii 4686 Å emission lines are not seen. The reason is the low S/N that gives an upper limit on the strength of not identified lines EW< 7 Å.
4.15. CP Pup
CP Pup discovered by Dawson (see Dawson & Shapley 1942) is one of the fastest (t3 ~ 8d) and the brightest (~ ) novae ever observed (Duerbeck 1987a). Its outburst and post-outburst evolution are covered well by observations (see, for example, Duerbeck 1987a; O’Donoghue et al. 1989; Diaz & Steiner 1991; White et al. 1993; Patterson & Warner 1998; Bianchini et al. 2012, and references therein). However, some parameters of the nova, such as spectral and photometric orbital periods, white dwarf mass, and the existence of a magnetic field, are still discussed in the literature (for more details see Bianchini et al. 2012). The extended shell around CP Pup was discovered by Zwicky about 13 yr after the outburst (see Bowen 1956) and then was observed and studied by many authors (Seitter & Duerbeck 1980; Williams 1982; Cohen & Rosenthal 1983; Duerbeck 1987b; Gill & O’Brien 1998). The last observations of the expanding shell, together with a critical discussion of the results obtained on the basis of the previous observations, are presented by Downes & Duerbeck (2000). They estimate a distance to CP Pup of 1140 pc and suggest that there is fast- and slow-moving material in the shell.
The spectrum of CP Pup shown in Fig. 1 does not differ substantially from the spectra of this nova, which is presented and described by other authors (Duerbeck et al. 1987; O’Donoghue et al. 1989; Bianchini et al. 1991, 1992; White et al. 1993; Bianchini et al. 2012). The continuum is strong and very steep in the blue. The strongest emissions in the spectrum belong to H i, He i, and He ii. The Bowen blend is only slightly weaker than He ii 4686 Å, and the C iv 5805 Å emission line is seen as well. The Balmer lines from Hα to H8 are the most intensive emissions in the spectrum with FWHM of about 1347 ± 53 km s-1 which is remarkably greater in comparison to the 1061 ± 63 km s-1 FWHM of He ii (Table 3).
4.16. BT Mon
BT Mon was discovered by Wachmann (Duerbeck 1987a) on December 17, 1939. The exact moment of the maximum and the nova’s maximum brightness are unknown. Many different values for t3 of the nova are found in the literature, but there is no consensus about its speed class (see, for instance, the discussion in Gill & O’Brien 1998). BT Mon is an eclipsing binary with  , eclipse amplitude ~
 , and orbital inclination i ~ 82° (Robinson et al. 1982; Schaefer & Patterson 1983; Smith et al. 1998). The exact nature of the system is not known, and the following are still under discussion: high-velocity gas flows, existence of accretion disk, white dwarf magnetic field, etc. (Seitter 1984; Kaitchuck et al. 1994; White et al. 1996; Smith et al. 1998, and references therein). Marsh et al. (1983) detected a nebulae around BT Mon using Hα/[N ii] spectral observations and estimated a distance of ~1800 pc. Optical direct imaging observations presented by Gill & O’Brien (1998) were in good agreement with the results of Marsh et al. (1983). It is interesting that Gill & O’Brien (2000) were not able to detect the nebula in HST images of BT Mon.
In the RSS spectrum of BT Mon, obtained at orbital phase 0.605 ± 0.002 (ephemeris from Smith et al. 1998), a relatively strong but not so steep blue continuum is apparent. Our spectrum is very similar to what was observed by Williams (1983) in 1980−1981. The Balmer lines are very intensive and easily seen in emission up to H10. The He ii emission at 4686 Å is stronger than Hβ, and the line at 5412 Å is also visible. The emission lines of He i like 5876 Å, 4922 Å, 4471 Å and 4026 Å are obvious as well (Fig. 1). The FWHM of He ii 4686 Å 852 ± 11 km s-1 is much smaller than the mean FWHM of Hβ and Hγ1137 ± 21 km s-1. The FWHM of Hβ, Hγ, and He ii 4686 Å and the EW of Hβ and Hγ are in good agreement with those measured by White et al. (1996) at similar orbital phases, but the one measured by us EW for He ii 4686 Å is about twice smaller than their value (Table 3).
Equivalent widths and FWHM of the emission lines in the targets spectra.
4.17. RR Pic
RR Pic is among the brightest classical novae with a pre- and post-outburst magnitude V ~ 12m. It exploded as a typical slow nova in 1925 (time to decline by 3 mag t3 = 150d, Duerbeck 1987a) reaching V ~ 1m at its maximum (Warner 2008). Because of its brightness, RR Pic is one of the most studied novae (see Jones 1931; Warner 1986; Schmidtobreick et al. 2003; Ribeiro & Diaz 2006; Schmidtobreick et al. 2008, and references therein). An extended shell with a complex shape around RR Pic has been known and has been well documented for long time (Williams & Gallagher 1979; Duerbeck & Seitter 1979; Gill & O’Brien 1998; Downes & Duerbeck 2000). Some authors (Haefner & Metz 1982; Warner 1986) have suggested that the nova is an eclipsing binary with  (Vogt 1975) whose orbital plane is inclined to the line of sight by about ~70°. Others did not confirm the presence of an eclipse (see the discussion in Schmidtobreick et al. 2008).
continued.
Our spectrum of RR Pic reveals a strong blue continuum. The strongest features are the Balmer series and He ii emission lines (Fig. 1). The only additional, strong emission is the Bowen blend. The spectrum is very similar to the one observed by Ribeiro & Diaz (2006) during 2001−2003. Using the corrected ephemeris given in Schmidtobreick et al. (2005a), we find that our spectrum was obtained at orbital phase 0.25 ± 0.03. The EW of ~21 Å for Hα measured by us (Table 3) is close to the values measured by Schmidtobreick et al. (2003) at similar phases. The FWHM of the Balmer and He ii emissions, which we estimated using Hβ, Hγ, He ii 4686 Å, and 5412 Å, are practically the same, 1118 ± 58 km s-1 and 1061 ± 116 km s-1, respectively.
4.18. GI Mon
According to Duerbeck (1987a), GI Mon is a fast nova whose maximum is poorly covered by observations. It was discovered by Wolf on February 4, 1918. Woudt et al. (2004) suggest an orbital period of  , but it was not confirmed by the observations of Rodríguez-Gil & Torres (2005). Gill & O’Brien (1998) failed to resolve a shell around GI Mon.
A steep blue continuum dominates our spectrum of GI Mon. Additionally, only weak emissions of Hα, Hβ, He ii 4886 Å, and the Bowen blend can be seen. The RSS spectrum of GI Mon is very similar to the only published quiescent spectrum obtained by Liu & Hu (2000) in 1998. Even the 4.5 Å Hα EW measured by them is very close to our value of 4.0 Å (Fig. 1 and Table 3). Keeping the similarity of ours and Liu & Hu (2000) spectra in mind, it is interesting to mention that Bianchini et al. (1991) reported weak Balmer and He ii emissions in the spectrum of GI Mon. In their next paper (Bianchini et al. 1992), however, they include this nova in the group of objects showing strong He ii emission lines.
4.19. OY Ara
OY Ara was discovered by W. Fleming on Harvard plates during the outburst in 1910 (Pickering 1910; Fleming & Pickering 1912). It is a moderately fast nova with t3 ~ 80d and a peculiar secondary maximum (Duerbeck 1987a). Zhao & McClintock (1997) found that OY Ara is an eclipsing system with an orbital period of ~0.16 days and masses of the components M1 = 0.82 M⊙ and M2 = 0.34 M⊙. They suggested a very high rate of mass transfer for this nova.
Comparing a single spectrum obtained in 1994 with the 38 obtained in 1995 and covering the full orbital period, Zhao & McClintock (1997) found that the spectrum of the OY Ara remnant varies markedly on a one-year timescale, as well as during the orbital cycle. In general, our spectrum of OY Ara (Fig. 1) is very similar to the spectrum obtained in 1994 and the averaged 1995 spectra in both continuum and lines. The Balmer lines, well seen up to Hδ, are the strongest emission features. The emissions of He ii, He i, and Bowen blend are obviously weaker in our spectrum. The EW measured by us (Table 3) are systematically larger than the mean values shown by Zhao & McClintock (1997) in their Table 4. All these differences are most probably caused by the orbital motion. As seen in Fig. 5 of Zhao & McClintock (1997), our spectrum closely resembles those obtained at phase 0. It is very difficult to estimate the exact orbital phase at which our spectrum of OY Ara was obtained using the Zhao & McClintock (1997) ephemeris because of the very large error accumulated in more than 38 000 cycles since the moment T0.
4.20. CN Vel
CN Vel is a poorly studied, very slow nova with t3> 800d (Duerbeck 1987a). It was discovered by H. Leavitt on a photographic plate obtained on December 5, 1905. Perhaps the most complete light curve for the years before and after the outburst was published by Walker & Shapley (1933). The only spectrum obtained about one and a half years after its discovery was described by Cannon & Pickering (1916). Two spectral observations of the remnant were reported later by Bianchini et al. (1991) and Zwitter & Munari (1996).
The spectra of CN Vel obtained in 1991 and 1995 (Bianchini et al. 1991; Zwitter & Munari 1996) are dominated by a strong blue continuum. In addition only very weak emissions of Hα and He ii 4686 Å are visible. Bianchini et al. (1991) reported on an intriguing “blue flare” observed in February 1991. A recent low-resolution spectrum obtained in May 2009 (Tappert et al. 2013) demonstrates a strong blue continuum and not very strong emission features. Comparatively intensive are Hα and the Bowen blend. The other visible Balmer and He i emission lines are weak. The Hα radial velocities periodogram analysis carried out by Tappert et al. (2013) suggests an orbital period  for CN Vel.
The blue continuum is seen well in our spectrum of CN Vel (Fig. 1). There are no obvious line features because of the very low S/N that determines an upper limit for the equivalent width of unidentified lines <13 Å.
4.21. X Ser
X Ser was discovered by H. Leavitt on Harvard plates, several years after its outburst in 1903 (Leavitt & Pickering 1908). This is a very slow nova, which remained near its maximum light between May 5 and September 21, 1903, whose t3 decline time was about 555 days (Duerbeck & Seitter 1990). Thorstensen & Taylor (2000) found a long ( ) spectroscopic orbital period for X Ser. Brightness variations with different amplitudes and characteristic times are typical of this old nova during quiescence (Duerbeck & Seitter 1990; Howell et al. 1990; Honeycutt et al. 1998). Spectral observations during the X Ser outburst are missing. The numerous published spectra of the remnant (Williams 1983; Shara et al. 1986; Duerbeck & Seitter 1990; Szkody & Howell 1992; Ringwald et al. 1996; Thorstensen & Taylor 2000) are evidence of remarkable changes in the continuum and the spectral lines.
At the time of our observations, only the Balmer emission lines from Hα to Hδ are undoubtedly presented in the spectrum. They are superimposed on a not very strong or very steep hot continuum (Fig. 1). Very weak He i emission lines (e.g., 5876 Å) can hardly be seen in the spectrum. There are not even traces of features like He ii 4686 Å, sometimes observed as strong emissions in the past.
4.22. DY Pup
DY Pup was discovered by I.E. Woods about twenty years after its outburst in January 1902 (see Shapley 1921). In Duerbeck (1987a) the object is classified as a slow nova with brightness in the maximum ~7m and t3 ~ 160d. The first and so far the only spectral observations of the post-nova remnant were published by Zwitter & Munari (1996). Gill & O’Brien (1998) revealed an extended shell around DY Pup with dimensions about 7′′× 5′′. An orbital period of 3336 is mentioned by Warner (2003).
A careful extraction of our spectrum of DY Pup presented in Fig. 1 shows a strong blue continuum and, maybe, only a very weak trace of the Hα emission. (The upper limit on the strength of unidentified lines is EW< 5 Å.) Eighteen years ago Zwitter & Munari (1996) observed a very faint Hα emission superimposed on a strong blue continuum, very similar to the present one.
5. Emission line intensities
Because of the unsuitable placement of Hα on the very edge of the CCD chip, the measured by us equivalent widths should only be considered as a rough estimate (see Sect. 2). Nevertheless, the change in the Hα equivalent width with the time since the outburst is consistent with those described by Ringwald et al. (1996). The dependence of the Hα equivalent width on the inclination of the orbit (Warner 1987) shows that this EW should be about 70 Å even for systems with the greatest orbital inclination. Four of our objects (V382 Cen, V868 Cen, V842 Cen, BY Cir) show larger EWs, but for all of them there are indications that the nebular spectrum has not disappeared completely and that Hα is blended with the lines of [N ii]. T Pyx demonstrates a very strong Hα, too, but our spectrum has only been obtained about one year after its last outburst in 2011.
In Figs. 3 and 4 the changes in the Hβ and He ii 4686 Å EWs with the time since the outburst are compared to the published by Ringwald et al. (1996). The accordance in the EWs in the first 25 to 30 yr is good, while our values are slightly higher in the next years. Two stars −T Pyx and OY Ara− show remarkable deviations. As mentioned above, T Pyx was observed shortly after the outburst. The OY Ara spectrum, on the other hand, was most probably obtained during eclipse, when the hot continuum is weaker (see Sect. 4.19).
As Ringwald et al. (1996) noted, the ratio of the EWs of the Bowen blend and He ii 4686 Å do not correlate with the time since outburst (Fig. 5), which can be considered as observational evidence that the irradiation does not change remarkably over a relatively long time interval.
6. Nova shells
We searched for nova shells in both the Hα+[N ii] narrow-band images and the RSS long-slit spectra by the use of the appropriate iraf packages and tasks. In the narrow-band images of each of our objects, a PSF was generated using close, not blended field stars with brightness similar to the nova. After subtracting the PSF from the stars in the narrow-band image, we examined the resultant images looking for evidence of an extended nova shell. As a second approach, we examined the radial plot fit of the nova. Using three or four field stars for each nova, which were chosen like the stars used to generate the PSF, we determined their centres and next radial profiles were fit to the field stars and to the nova. We then compared the radial profiles of the nova and the field stars searching for extended shells. Obviously, the use of radial plots suggests that we assumed that the extended nova shells are spherically symmetric.
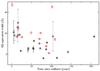 |
Fig. 3 Equivalent width of Hβ versus time since outburst. The symbols represents as follows: circles – this paper; diamonds – Ringwald et al. (1996). |
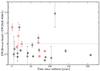 |
Fig. 5 EW(Bowen blend)/EW(He ii 4686 Å) ratio versus time since outburst. The symbols are as in Fig. 3. |
For the long-slit spectra, we used a method similar to the one described by Marsh et al. (1983). To remove the contamination of the stellar continuum and the Hα emission line, we determined the average spectral profile perpendicular to the dispersion in a featureless region of the continuum far enough away from the emission line. The average spectral profile was normalized to the maximum of the observed spectrum in each column perpendicular to the dispersion, defined by the fitting of a parabola to the seven maximal points. The normalized profile was then extracted pixel by pixel from the observed long-slit spectrum. In the resulting images we were searching for evidence of extended nova shells.
Applying the described methods for all our targets, we were only able to detect expanding shells in both the long-slit spectra and the narrow-band direct images for two objects −V842 Cen and V382 Vel.
6.1. V842 Cen
The extended shell of V842 Cen was detected for the first time by Gill & O’Brien (1998) in 1995 about eight years after its outburst. They reported a shell diameter ~ . Three years later the observations of Downes & Duerbeck (2000) revealed a shell of size
  .
.
The Hα+[N ii] narrow-band V842 Cen image, presented in Fig. 6, shows an approximately spherically symmetric shell. The shell is visible in the long-slit spectrum before and after the correction for the contamination of the stellar continuum and the Hα emission line as shown in Fig. 7. In the image with the uncorrected spectrum (Fig. 7), as well as in its cross section shown in Fig. 6, two maxima on both sides of the stellar spectrum are apparent. These maxima coincide with the peaks in the cross section of the corrected spectrum (Fig. 6). The separation of these peaks is  . From the cross sections and the radial profile (Fig. 6) for the outer diameter of the shell we obtain
  .
.
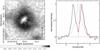 |
Fig. 6 Left: Hα+[N ii] narrow-band image of the V842 Cen extended shell on a logarithmic grey scale. Right: comparison of the radial profile of V842 Cen in the Hα+[N ii] narrow-band image after subtracting the average standard star profile (dashed line) with cross sections averaged perpendicular to the dispersion (±5 Å around the Hα emission line centre) in the long-slit spectrum before (dot-dashed line, Fig. 7 left) and after (continuous line, Fig. 7 right) removing the stellar continuum and the Hα emission line contamination. The profile and the cross sections were normalized to their maxima. |
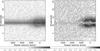 |
Fig. 7 Left: small part of the observed long-slit spectrum of V842 Cen in the region of Hα. Right: same spectrum, after the contamination of the stellar continuum and the Hα emission line has been removed. The slit position was NS with N at the top of the images. A logarithmic grey scale is used for both images. |
Two expansion velocities were suggested for V842 Cen (see the discussion in Downes & Duerbeck 2000). A velocity of about 525 km s-1 for the dense regions of the shell and ~2000 km s-1 for the low-density material. Assuming that the  shell ring is caused by the slowly expanding dense material and that the outer size
  of the shell reflects the expansion of the low-density material, their velocities measured in our spectrum are 500 ± 10 km s-1 and 1500 ± 90 km s-1 respectively. These velocities give an average distance to V842 Cen of about 1.5 ± 0.2 kpc. This value exceeds all previous estimations of the distance, independently of the method used. The reddening-based estimations of 0.9 kpc (Sekiguchi et al. 1989) and 1.0 kpc (Andrea et al. 1994) and the derived by the expansion parallax 1.3 kpc (Gill & O’Brien 1998) and 0.42 kpc (Downes & Duerbeck 2000). It should be noted, however, that the lower limit of our value for the V842 Cen distance agrees with the estimation of (Gill & O’Brien 1998). Our observations of the V842 Cen shell were obtained long after the previous ones, which permitted us to use them in our distance estimation, with the different shell components reflecting the expansion of the different density material for the first time. Moreover, the velocities measured in our spectrum seem to indicate a definite decrease in the expanding material velocities.
6.2. V382 Vel
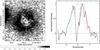
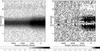
Our observations are the first detection of the V382 Vel expanding shell simultaneously in Hα+[N ii] narrow-band imaging and long-slit spectrum (Figs. 8 and 9). As seen in Fig. 8, the V382 Vel expanding shell shows better spherical symmetry in comparison to the V842 Cen (Fig. 6). Based on the radial plot and the spectrum cross-sections shown in Fig. 8, we obtain  for the outer diameter of the shell.
There are different expansion velocities published for the V382 Vel shell. Della Valle et al. (2002) give a velocity ≳3500 km s-1. Augusto & Diaz (2002) find an average velocity of 1600 km s-1, decreasing with time. A maximum expansion velocity of more than 5000 km s-1 was estimated by Shore et al. (2003). In our spectrum we measured a velocity of the expanding shell of about 1800 ± 100 km s-1, which is different from all those published so far. This leads to an estimate of the distance to V382 Vel of 0.8 ± 0.1 kpc. A distance to V382 Vel of about 1.7 kpc was obtained by Della Valle et al. (2002) using the maximum magnitude vs. rate-of-decline relationship method. Analysing and modelling ultraviolet spectra, Shore et al. (2003) estimated that the distance to V382 Vel is about 2.5 kpc. A comparison of ours and previously published distances to V382 Vel shows large differences between the particular estimates. Obviously, a more accurate estimation of the distance to this post-nova requires additional observations.
7. Conclusions
We presented recent long-slit and narrow-band imaging observations of 22 southern post-novae. We compared our new spectra of the post-novae remnants with the previously published ones and discussed the observed changes. The changes with the time since outburst of the equivalent widths of the Hβ and He ii 4686 Å emissions, as well as the ratio Bowen blend/He ii 4686 Å, are consistent with those in the Ringwald et al. (1996) survey.
Combining our data and data published in the literature, we estimated an average value α = 2.37 ± 0.74 for the exponent of the power law fitted to the post-novae continua. Our observations confirm the suggestion of Downes & Duerbeck (2000) that Nova Car 1972 is not a real nova and must be excluded from the old novae list.
We observed the expanding nebula around V842 Cen again and showed that it consists of inner and outer parts with diameters and , respectively, which are related to matter with different densities and current expansion velocities of about 500 km s-1 and 1500 km s-1. For the distance to V842 Cen, we obtained 1.5 kpc.
For the first time, we detected an expanding shell around V382 Vel. The outer diameter of the shell is around 12″, which in combination with the measured expansion velocity 1800 km s-1, gives a distance 0.8 kpc.
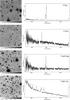 |
Fig. 10 Hα+[N ii] narrow-band image in linear grey scale (left) and extracted, not dereddened spectrum (right) for each of our targets. The images are 4′ × 4′ with north up and east to the left. The gaps in the spectra reflect the RSS interchip gaps. |
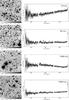 |
Fig. 10 continued. |
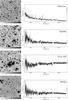 |
Fig. 10 continued. |
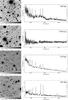 |
Fig. 10 continued. |
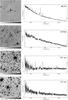 |
Fig. 10 continued. |
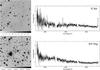 |
Fig. 10 continued. |
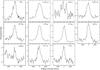 |
Fig. 11 Hβ profiles. |
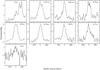 |
Fig. 12 Hγ profiles. |
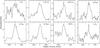 |
Fig. 13 Hδ profiles. |
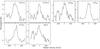 |
Fig. 14 Hε profiles. |
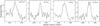 |
Fig. 15 H8 profiles. |
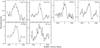 |
Fig. 16 HeI 5876 Å profiles. |
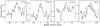 |
Fig. 17 CIV 5805 Å profiles. |
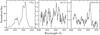 |
Fig. 18 [OIII] 4959 and 5007 Å profiles. |
 |
Fig. 19 HeII and Bowen blend profiles. |
There are some discrepancies between the values of α in Table 4 and Fig. 7 in Ringwald et al. (1996). For our Fig. 2 we used the values from their Table 4.
Acknowledgments
All of the observations reported in this paper were obtained with the Southern African Large Telescope (SALT). We are grateful to the referee Linda Schmidtobreick and the editor Steven Shore, for the valuable comments and suggestions. This research made use of the SIMBAD database, operated at the CDS, Strasbourg, France, and NASA’s Astrophysics Data System Bibliographic Services.
References
- Abbott, T. M. C., & Shafter, A. W. 1997, in IAU Colloq. 163: Accretion Phenomena and Related Outflows, eds. D. T. Wickramasinghe, G. V. Bicknell, & L. Ferrario, ASP Conf. Ser., 121, 679 [Google Scholar]
- Andrea, J., Drechsel, H., & Starrfield, S. 1994, A&A, 291, 869 [NASA ADS] [Google Scholar]
- Ashok, N. M., & Banerjee, D. P. K. 2003, A&A, 409, 1007 [NASA ADS] [CrossRef] [EDP Sciences] [Google Scholar]
- Augusto, A., & Diaz, M. 2002, in Classical Nova Explosions, eds. M. Hernanz, & J. José, AIP Conf. Ser., 637, 233 [Google Scholar]
- Balman, Ş., Retter, A., & Bos, M. 2006, AJ, 131, 2628 [NASA ADS] [CrossRef] [Google Scholar]
- Bianchini, A., della Valle, M., Orio, M., Ogelman, H., & Bianchi, L. 1991, The Messenger, 64, 32 [NASA ADS] [Google Scholar]
- Bianchini, A., Della Valle, M., Duerbeck, H. W., & Orio, M. 1992, The Messenger, 69, 42 [NASA ADS] [Google Scholar]
- Bianchini, A., Saygac, T., Orio, M., Della Valle, M., & Williams, R. 2012, A&A, 539, A94 [NASA ADS] [CrossRef] [EDP Sciences] [Google Scholar]
- Bowen, I. S. 1956, AJ, 61, 338 [Google Scholar]
- Buckley, D. A. H., Swart, G. P., & Meiring, J. G. 2006, SPIE Conf. Ser., 6267, 62670Z [Google Scholar]
- Burgh, E. B., Nordsieck, K. H., Kobulnicky, H. A., et al. 2003, in SPIE Conf. Ser. 4841, eds. M. Iye & A. F. M. Moorwood, 1463 [Google Scholar]
- Cannon, A. J., & Pickering, E. C. 1916, Annals of Harvard College Observatory, 76, 19 [Google Scholar]
- Cardelli, J. A., Clayton, G. C., & Mathis, J. S. 1989, ApJ, 345, 245 [NASA ADS] [CrossRef] [Google Scholar]
- Cohen, J. G., & Rosenthal, A. J. 1983, ApJ, 268, 689 [NASA ADS] [CrossRef] [Google Scholar]
- Crawford, S. M., Still, M., Schellart, P., et al. 2010, SPIE Conf. Ser., 7737, 25 [NASA ADS] [Google Scholar]
- Dawson, B. H., & Shapley, H. 1942, Harvard College Observatory Announcement Card, 637, 2 [NASA ADS] [Google Scholar]
- De Gennaro Aquino, I., Shore, S. N., Schwarz, G. J., et al. 2014, A&A, 562, A28 [NASA ADS] [CrossRef] [EDP Sciences] [Google Scholar]
- Della Valle, M., Pasquini, L., Daou, D., & Williams, R. E. 2002, A&A, 390, 155 [NASA ADS] [CrossRef] [EDP Sciences] [Google Scholar]
- Diaz, M. P., & Steiner, J. E. 1989, ApJ, 339, L41 [NASA ADS] [CrossRef] [Google Scholar]
- Diaz, M. P., & Steiner, J. E. 1990, Rev. Mex. Astron. Astrofis., 21, 369 [NASA ADS] [Google Scholar]
- Diaz, M. P., & Steiner, J. E. 1991, PASP, 103, 964 [NASA ADS] [CrossRef] [Google Scholar]
- Diaz, M. P., & Steiner, J. E. 1994, ApJ, 425, 252 [NASA ADS] [CrossRef] [Google Scholar]
- Diaz, M. P., Williams, R. E., Phillips, M. M., & Hamuy, M. 1995, MNRAS, 277, 959 [NASA ADS] [CrossRef] [Google Scholar]
- Downen, L. N., Iliadis, C., José, J., & Starrfield, S. 2013, ApJ, 762, 105 [NASA ADS] [CrossRef] [Google Scholar]
- Downes, R. A., & Duerbeck, H. W. 2000, AJ, 120, 2007 [NASA ADS] [CrossRef] [Google Scholar]
- Downes, R. A., Webbink, R. F., Shara, M. M., et al. 2006, VizieR Online Data Catalog: V/123 [Google Scholar]
- Duerbeck, H. W. 1987a, Space Sci. Rev., 45, 1 [NASA ADS] [CrossRef] [Google Scholar]
- Duerbeck, H. W. 1987b, The Messenger, 50, 8 [NASA ADS] [Google Scholar]
- Duerbeck, H. W., & Seitter, W. C. 1979, The Messenger, 17, 1 [NASA ADS] [Google Scholar]
- Duerbeck, H. W., & Seitter, W. C. 1987, Ap&SS, 131, 467 [NASA ADS] [CrossRef] [Google Scholar]
- Duerbeck, H. W., & Seitter, W. C. 1990, in IAU Colloq. 122, Physics of Classical Novae, eds. A. Cassatella, & R. Viotti (Berlin: Springer Verlag), Lect. Notes Phys., 369, 165 [Google Scholar]
- Duerbeck, H. W., Seitter, W. C., & Duemmler, R. 1987, MNRAS, 229, 653 [NASA ADS] [Google Scholar]
- Evans, A., Yudin, R. V., Naylor, T., Ringwald, F. A., & Koch Miramond, L. 2002, A&A, 384, 504 [NASA ADS] [CrossRef] [EDP Sciences] [Google Scholar]
- Fleming, W. P. S., & Pickering, E. C. 1912, Ann. Harvard College Obs., 56, 165 [Google Scholar]
- Gill, C. D., & O’Brien, T. J. 1998, MNRAS, 300, 221 [NASA ADS] [CrossRef] [Google Scholar]
- Gill, C. D., & O’Brien, T. J. 2000, MNRAS, 314, 175 [NASA ADS] [CrossRef] [Google Scholar]
- Gilmozzi, R., & Selvelli, P. 2007, A&A, 461, 593 [NASA ADS] [CrossRef] [EDP Sciences] [Google Scholar]
- Goranskij, V., Shugarov, S., Zharova, A., Kroll, P., & Barsukova, E. A. 2010, Peremennye Zvezdy, 30, 4 [NASA ADS] [Google Scholar]
- Hachisu, I., Kato, M., & Cassatella, A. 2008, ApJ, 687, 1236 [NASA ADS] [CrossRef] [Google Scholar]
- Haefner, R., & Metz, K. 1982, A&A, 109, 171 [NASA ADS] [Google Scholar]
- Henize, K. G. 1967, ApJS, 14, 125 [NASA ADS] [CrossRef] [Google Scholar]
- Henize, K. G., & Liller, W. 1975, ApJ, 200, 694 [NASA ADS] [CrossRef] [Google Scholar]
- Hettlage, C., Buckley, D. A. H., Charles, A. C., et al. 2010, SPIE Conf. Ser., 7737 [Google Scholar]
- Hoffmeister, C. 1964, Inform. Bull. Var. Stars, 45, 1 [NASA ADS] [Google Scholar]
- Honeycutt, R. K., Robertson, J. W., & Turner, G. W. 1998, AJ, 115, 2527 [NASA ADS] [CrossRef] [Google Scholar]
- Howell, S. B., Szkody, P., Kreidl, T. J., Mason, K. O., & Puchnarewicz, E. M. 1990, PASP, 102, 758 [NASA ADS] [CrossRef] [Google Scholar]
- Huth, H., & Hoffmeister, C. 1964, IBVS, 60, 1 [NASA ADS] [Google Scholar]
- Johnson, C. B., Schaefer, B. E., Kroll, P., & Henden, A. A. 2014, ApJ, 780, L25 [NASA ADS] [CrossRef] [Google Scholar]
- Jones, H. S. 1931, Ann. Cape Obs., 10, 9 [Google Scholar]
- Kaitchuck, R. H., Schlegel, E. M., Honeycutt, R. K., et al. 1994, ApJS, 93, 519 [NASA ADS] [CrossRef] [Google Scholar]
- Kato, M., & Hachisu, I. 2003, ApJ, 598, L107 [NASA ADS] [CrossRef] [Google Scholar]
- Kato, T., Kanatsu, K., Takamizawa, K., Takao, A., & Stubbings, R. 2000, IAU Circ., 7552, 1 [NASA ADS] [Google Scholar]
- Kato, M., Hachisu, I., Kiyota, S., & Saio, H. 2008, ApJ, 684, 1366 [NASA ADS] [CrossRef] [Google Scholar]
- Kobulnicky, H. A., Nordsieck, K. H., Burgh, E. B., et al. 2003, in SPIE Conf. Ser. 4841, eds. M. Iye, & A. F. M. Moorwood, 1634 [Google Scholar]
- Leavitt, H. S., & Pickering, E. C. 1908, Harvard College Obs. Circ., 142, 1 [NASA ADS] [Google Scholar]
- Leavitt, H. S., & Pickering, E. C. 1913, Harvard College Obs. Circ., 179, 1 [NASA ADS] [Google Scholar]
- Liller, W., & Hamuy, M. 1991, IAU Circ., 5230, 1 [NASA ADS] [Google Scholar]
- Liller, W., & Overbeek, M. D. 1983, IAU Circ., 3764, 1 [NASA ADS] [Google Scholar]
- Liller, W., Benetti, S., Cappellaro, E., et al. 1995a, IAU Circ., 6130, 1 [NASA ADS] [Google Scholar]
- Liller, W., Overbeek, D., Gilmore, A. C., Hearnshaw, J. B., & Watson, L. C. 1995b, IAU Circ., 6139, 1 [NASA ADS] [Google Scholar]
- Liller, W., Overbeek, D., & Mattei, J. 1996, IAU Circ., 6463, 1 [NASA ADS] [Google Scholar]
- Liu, W., & Hu, J. Y. 2000, ApJS, 128, 387 [NASA ADS] [CrossRef] [Google Scholar]
- Lyke, J. E., Koenig, X. P., Barlow, M. J., et al. 2003, AJ, 126, 993 [NASA ADS] [CrossRef] [Google Scholar]
- Lynden-Bell, D. 1969, Nature, 223, 690 [NASA ADS] [CrossRef] [Google Scholar]
- MacConnell, D. J., Prato, C. E., & Briceno, A. C. 1978, IBVS, 1476, 1 [NASA ADS] [Google Scholar]
- Marsh, T. R., Oke, J. B., & Wade, R. A. 1983, MNRAS, 205, 33 [NASA ADS] [CrossRef] [Google Scholar]
- McNaught, R. H., Feast, M. W., Carter, B. S., & Laing, J. D. 1986, IAU Circ., 4274, 1 [NASA ADS] [Google Scholar]
- Narloch, W., Kaluzny, J., Krzeminski, W., et al. 2014, Balt. Astron., 23, 1 [NASA ADS] [Google Scholar]
- O’Donoghue, D., Warner, B., Wargau, W., & Grauer, A. D. 1989, MNRAS, 240, 41 [NASA ADS] [CrossRef] [Google Scholar]
- O’Donoghue, D., Buckley, D. A. H., Balona, L. A., et al. 2006, MNRAS, 372, 151 [NASA ADS] [CrossRef] [Google Scholar]
- Patterson, J., & Warner, B. 1998, PASP, 110, 1026 [NASA ADS] [CrossRef] [Google Scholar]
- Patterson, J., Uthas, H., Kemp, J., et al. 2013, MNRAS, 434, 1902 [NASA ADS] [CrossRef] [Google Scholar]
- Pickering, E. C. 1910, Harvard College Obs. Bull., 427, 1 [NASA ADS] [Google Scholar]
- Pogson, N. R. 1865, Astron. Nachr., 64, 170 [Google Scholar]
- Pych, W. 2004, PASP, 116, 148 [NASA ADS] [CrossRef] [Google Scholar]
- Ribeiro, F. M. A., & Diaz, M. P. 2006, PASP, 118, 84 [NASA ADS] [CrossRef] [Google Scholar]
- Ringwald, F. A., Naylor, T., & Mukai, K. 1996, MNRAS, 281, 192 [NASA ADS] [Google Scholar]
- Ringwald, F. A., Wade, R. A., Orosz, J. A., & Ciardullo, R. B. 1998, BAAS, 30, 893 [NASA ADS] [Google Scholar]
- Robinson, E. L., Nather, R. E., & Kepler, S. O. 1982, ApJ, 254, 646 [NASA ADS] [CrossRef] [Google Scholar]
- Rodríguez-Gil, P., & Torres, M. A. P. 2005, A&A, 431, 289 [NASA ADS] [CrossRef] [EDP Sciences] [Google Scholar]
- Schaefer, B. E. 2010a, ApJS, 187, 275 [NASA ADS] [CrossRef] [Google Scholar]
- Schaefer, B. E. 2010b [arXiv:1009.3197] [Google Scholar]
- Schlafly, E. F., & Finkbeiner, D. P. 2011, ApJ, 737, 103 [NASA ADS] [CrossRef] [Google Scholar]
- Schaefer, B. E., & Patterson, J. 1983, ApJ, 268, 710 [NASA ADS] [CrossRef] [Google Scholar]
- Schaefer, B. E., & Ringwald, F. A. 1995, ApJ, 447, L45 [NASA ADS] [CrossRef] [Google Scholar]
- Schaefer, B. E., Pagnotta, A., & Shara, M. M. 2010, ApJ, 708, 381 [NASA ADS] [CrossRef] [Google Scholar]
- Schaefer, B. E., Landolt, A. U., Linnolt, M., et al. 2013, ApJ, 773, 55 [NASA ADS] [CrossRef] [Google Scholar]
- Schmidtobreick, L., Tappert, C., & Saviane, I. 2003, MNRAS, 342, 145 [NASA ADS] [CrossRef] [Google Scholar]
- Schmidtobreick, L., Galli, L., Saviane, I., Tappert, C., & Whiting, A. 2005a, in The Light-Time Effect in Astrophysics: Causes and cures of the O-C diagram, ed. C. Sterken, ASP Conf. Ser., 335, 333 [Google Scholar]
- Schmidtobreick, L., Galli, L., Whiting, A., Tappert, C., & Carver, A. J. 2005b, PASP, 117, 944 [NASA ADS] [CrossRef] [Google Scholar]
- Schmidtobreick, L., Tappert, C., Bianchini, A., & Mennickent, R. E. 2005c, A&A, 432, 199 [NASA ADS] [CrossRef] [EDP Sciences] [Google Scholar]
- Schmidtobreick, L., Papadaki, C., Tappert, C., & Ederoclite, A. 2008, MNRAS, 389, 1345 [NASA ADS] [CrossRef] [Google Scholar]
- Schmidtobreick, L., Rodríguez-Gil, P., & Gänsicke, B. T. 2012, Mem. Soc. Astron. It., 83, 610 [NASA ADS] [Google Scholar]
- Schwarz, G. J., Ness, J.-U., Osborne, J. P., et al. 2011, ApJS, 197, 31 [NASA ADS] [CrossRef] [Google Scholar]
- Seitter, W. C. 1984, Ap&SS, 99, 95 [NASA ADS] [CrossRef] [Google Scholar]
- Seitter, W. C., & Duerbeck, H. W. 1980, Mitteilungen der Astron. Gesellschaft Hamburg, 50, 70 [NASA ADS] [Google Scholar]
- Sekiguchi, K., Feast, M. W., Fairall, A. P., & Winkler, H. 1989, MNRAS, 241, 311 [NASA ADS] [CrossRef] [Google Scholar]
- Selvelli, P. 2004, Balt. Astron., 13, 93 [Google Scholar]
- Selvelli, P., & Gilmozzi, R. 2013, A&A, 560, A49 [NASA ADS] [CrossRef] [EDP Sciences] [Google Scholar]
- Shafter, A. W. 1997, ApJ, 487, 226 [NASA ADS] [CrossRef] [Google Scholar]
- Shapley, H. 1921, Harvard College Obs. Bull., 760, 1 [NASA ADS] [Google Scholar]
- Shara, M. M., Livio, M., Moffat, A. F. J., & Orio, M. 1986, ApJ, 311, 163 [NASA ADS] [CrossRef] [Google Scholar]
- Shara, M. M., Martin, C. D., Seibert, M., et al. 2007, Nature, 446, 159 [NASA ADS] [CrossRef] [Google Scholar]
- Shara, M. M., Mizusawa, T., Wehinger, P., et al. 2012a, ApJ, 758, 121 [NASA ADS] [CrossRef] [Google Scholar]
- Shara, M. M., Mizusawa, T., Zurek, D., et al. 2012b, ApJ, 756, 107 [NASA ADS] [CrossRef] [Google Scholar]
- Shore, S. N., Schwarz, G., Bond, H. E., et al. 2003, AJ, 125, 1507 [NASA ADS] [CrossRef] [Google Scholar]
- Shore, S. N., Augusteijn, T., Ederoclite, A., & Uthas, H. 2011, A&A, 533, L8 [NASA ADS] [CrossRef] [EDP Sciences] [Google Scholar]
- Shore, S. N., Schwarz, G. J., De Gennaro Aquino, I., et al. 2013, A&A, 549, A140 [NASA ADS] [CrossRef] [EDP Sciences] [Google Scholar]
- Sion, E. M., Szkody, P., Mukadam, A., et al. 2013, ApJ, 772, 116 [NASA ADS] [CrossRef] [Google Scholar]
- Smith, D. A., Dhillon, V. S., & Marsh, T. R. 1998, MNRAS, 296, 465 [NASA ADS] [CrossRef] [Google Scholar]
- Strohmeier, W. 1964, Inf. Bull. Variable Stars, 59, 1 [NASA ADS] [Google Scholar]
- Strope, R. J., Schaefer, B. E., & Henden, A. A. 2010, AJ, 140, 34 [NASA ADS] [CrossRef] [Google Scholar]
- Surina, F., Hounsell, R. A., Bode, M. F., et al. 2014, AJ, 147, 107 [NASA ADS] [CrossRef] [Google Scholar]
- Szkody, P., & Howell, S. B. 1992, ApJS, 78, 537 [NASA ADS] [CrossRef] [Google Scholar]
- Tappert, C., Ederoclite, A., Mennickent, R. E., Schmidtobreick, L., & Vogt, N. 2012, MNRAS, 423, 2476 [NASA ADS] [CrossRef] [Google Scholar]
- Tappert, C., Schmidtobreick, L., Vogt, N., & Ederoclite, A. 2013, MNRAS, 436, 2412 [NASA ADS] [CrossRef] [Google Scholar]
- Tappert, C., Vogt, N., Della Valle, M., Schmidtobreick, L., & Ederoclite, A. 2014, MNRAS, 442, 565 [NASA ADS] [CrossRef] [Google Scholar]
- Thomas, H. L. 1940, Harvard College Obs. Bull., 912, 10 [NASA ADS] [Google Scholar]
- Thoroughgood, T. D., Dhillon, V. S., Littlefair, S. P., Marsh, T. R., & Smith, D. A. 2001, MNRAS, 327, 1323 [NASA ADS] [CrossRef] [Google Scholar]
- Thorstensen, J. R., & Taylor, C. J. 2000, MNRAS, 312, 629 [NASA ADS] [CrossRef] [Google Scholar]
- Vogt, N. 1975, A&A, 41, 15 [NASA ADS] [Google Scholar]
- Walker, A. D., & Shapley, H. 1933, Ann. Harvard College Obs., 84, 189 [NASA ADS] [Google Scholar]
- Warner, B. 1986, MNRAS, 219, 751 [NASA ADS] [CrossRef] [Google Scholar]
- Warner, B. 1987, MNRAS, 227, 23 [NASA ADS] [Google Scholar]
- Warner, B. 2003, Mon. Notes Astron. Soc. S. Afr., 62, 74 [NASA ADS] [Google Scholar]
- Warner, B. 2008, in Classical Novae, eds. M. F. Bode, & A. Evans (Cambridge: Cambridge University Press), 16 [Google Scholar]
- White, II, J. C., Honeycutt, R. K., & Horne, K. 1993, ApJ, 412, 278 [NASA ADS] [CrossRef] [Google Scholar]
- White, II, J. C., Schlegel, E. M., & Honeycutt, R. K. 1996, ApJ, 456, 777 [NASA ADS] [CrossRef] [Google Scholar]
- Whitelock, P. A. 1987, Mon. Notes Astron. Soc. S. Afr., 46, 72 [Google Scholar]
- Williams, G. 1983, ApJS, 53, 523 [NASA ADS] [CrossRef] [Google Scholar]
- Williams, R. E. 1982, ApJ, 261, 170 [NASA ADS] [CrossRef] [Google Scholar]
- Williams, R. E. 1994, ApJ, 426, 279 [NASA ADS] [CrossRef] [Google Scholar]
- Williams, R. E., & Gallagher, J. S. 1979, ApJ, 228, 482 [NASA ADS] [CrossRef] [Google Scholar]
- Williams, P., Lee, S., Pearce, A., et al. 1999, IAU Circ., 7176, 1 [NASA ADS] [Google Scholar]
- Williams, R. E., Hamuy, M., Phillips, M. M., et al. 2003, J. Astron. Data, 9, 3 [Google Scholar]
- Woodward, C. E., Wooden, D. H., Pina, R. K., & Fisher, R. S. 1999, IAU Circ., 7220, 3 [NASA ADS] [Google Scholar]
- Woudt, P. A., & Warner, B. 2002, MNRAS, 335, 44 [NASA ADS] [CrossRef] [Google Scholar]
- Woudt, P. A., & Warner, B. 2003, MNRAS, 340, 1011 [NASA ADS] [CrossRef] [Google Scholar]
- Woudt, P. A., & Warner, B. 2010, MNRAS, 403, 398 [NASA ADS] [CrossRef] [Google Scholar]
- Woudt, P. A., Warner, B., & Pretorius, M. L. 2004, MNRAS, 351, 1015 [NASA ADS] [CrossRef] [Google Scholar]
- Woudt, P. A., Steeghs, D., Karovska, M., et al. 2009a, ApJ, 706, 738 [NASA ADS] [CrossRef] [Google Scholar]
- Woudt, P. A., Warner, B., Osborne, J., & Page, K. 2009b, MNRAS, 395, 2177 [NASA ADS] [CrossRef] [Google Scholar]
- Yan Tse, J., Hearnshaw, J. B., Rosenzweig, P., et al. 2001, MNRAS, 324, 553 [NASA ADS] [CrossRef] [Google Scholar]
- Zhao, P., & McClintock, J. E. 1997, ApJ, 483, 899 [NASA ADS] [CrossRef] [Google Scholar]
- Zwitter, T., & Munari, U. 1995, A&AS, 114, 575 [NASA ADS] [Google Scholar]
- Zwitter, T., & Munari, U. 1996, A&AS, 117, 449 [NASA ADS] [CrossRef] [EDP Sciences] [Google Scholar]
All Tables
All Figures
|
Fig. 1 Normalized at 5500 Å flux spectra of the targets. The spectra are dereddened and have been smoothed with a 3 × 3 box filter. The gaps in the spectra reflect the RSS interchip gaps. |
| In the text | |
|
Fig. 2 Power law exponents α as a function of the time since outburst. The symbols represent as follows: circles – this paper; diamonds – Ringwald et al. (1996); squares – Tappert et al. (2012); triangles up – Schmidtobreick et al. (2005c); tiangles down – Tappert et al. (2014). The double exponents for V630 Sgr, V842 Cen, V2109 Oph, V604 Aql and V2104 Oph (Schmidtobreick et al. 2005c; Tappert et al. 2012, 2014) are connected with dashed lines. Our exponent for V842 Cen is also connected by a dashed line to the line between its two exponents from Schmidtobreick et al. (2005c). The α values for the only common object in ours and Ringwald et al. (1996) samples, X Ser, are connected with a dashed line as well. The dot-dashed line represents the value α = 2.33 for a steady-state accretion disk. |
| In the text | |
|
Fig. 3 Equivalent width of Hβ versus time since outburst. The symbols represents as follows: circles – this paper; diamonds – Ringwald et al. (1996). |
| In the text | |
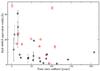 |
Fig. 4 Equivalent width of He ii 4686 Å versus time since outburst. The symbols are as in Fig. 3. |
| In the text | |
|
Fig. 5 EW(Bowen blend)/EW(He ii 4686 Å) ratio versus time since outburst. The symbols are as in Fig. 3. |
| In the text | |
|
Fig. 6 Left: Hα+[N ii] narrow-band image of the V842 Cen extended shell on a logarithmic grey scale. Right: comparison of the radial profile of V842 Cen in the Hα+[N ii] narrow-band image after subtracting the average standard star profile (dashed line) with cross sections averaged perpendicular to the dispersion (±5 Å around the Hα emission line centre) in the long-slit spectrum before (dot-dashed line, Fig. 7 left) and after (continuous line, Fig. 7 right) removing the stellar continuum and the Hα emission line contamination. The profile and the cross sections were normalized to their maxima. |
| In the text | |
|
Fig. 7 Left: small part of the observed long-slit spectrum of V842 Cen in the region of Hα. Right: same spectrum, after the contamination of the stellar continuum and the Hα emission line has been removed. The slit position was NS with N at the top of the images. A logarithmic grey scale is used for both images. |
| In the text | |
|
Fig. 10 Hα+[N ii] narrow-band image in linear grey scale (left) and extracted, not dereddened spectrum (right) for each of our targets. The images are 4′ × 4′ with north up and east to the left. The gaps in the spectra reflect the RSS interchip gaps. |
| In the text | |
|
Fig. 10 continued. |
| In the text | |
|
Fig. 10 continued. |
| In the text | |
|
Fig. 10 continued. |
| In the text | |
|
Fig. 10 continued. |
| In the text | |
|
Fig. 10 continued. |
| In the text | |
|
Fig. 11 Hβ profiles. |
| In the text | |
|
Fig. 12 Hγ profiles. |
| In the text | |
|
Fig. 13 Hδ profiles. |
| In the text | |
|
Fig. 14 Hε profiles. |
| In the text | |
|
Fig. 15 H8 profiles. |
| In the text | |
|
Fig. 16 HeI 5876 Å profiles. |
| In the text | |
|
Fig. 17 CIV 5805 Å profiles. |
| In the text | |
|
Fig. 18 [OIII] 4959 and 5007 Å profiles. |
| In the text | |
|
Fig. 19 HeII and Bowen blend profiles. |
| In the text | |
Current usage metrics show cumulative count of Article Views (full-text article views including HTML views, PDF and ePub downloads, according to the available data) and Abstracts Views on Vision4Press platform.
Data correspond to usage on the plateform after 2015. The current usage metrics is available 48-96 hours after online publication and is updated daily on week days.
Initial download of the metrics may take a while.