Free Access
Fig. 7
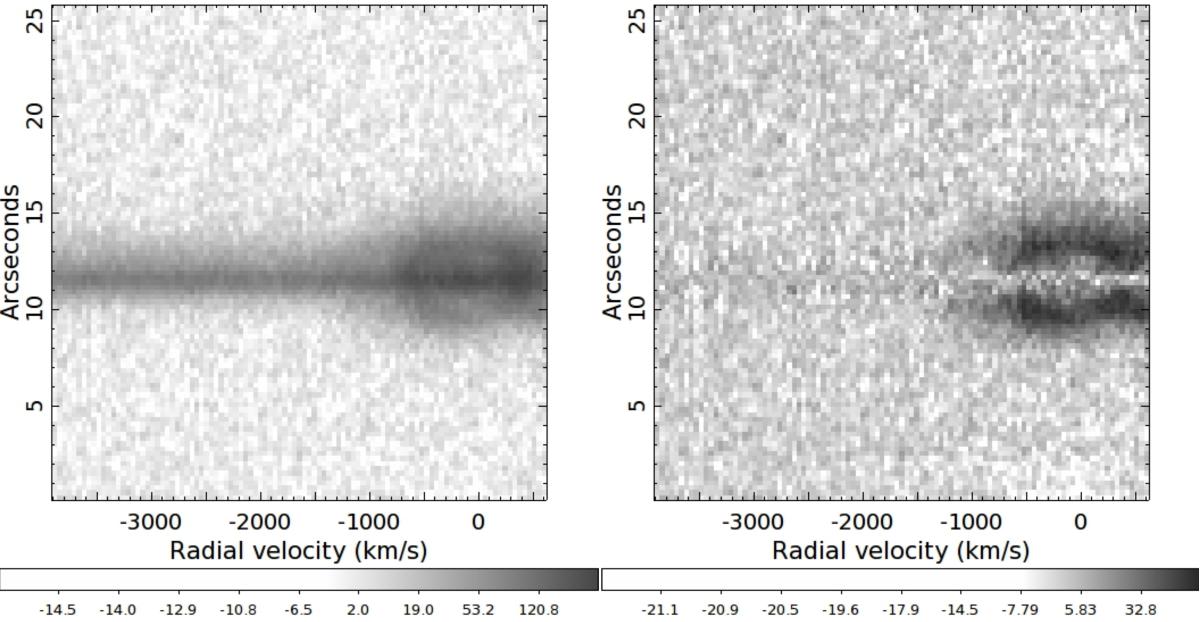
Left: small part of the observed long-slit spectrum of V842 Cen in the region of Hα. Right: same spectrum, after the contamination of the stellar continuum and the Hα emission line has been removed. The slit position was NS with N at the top of the images. A logarithmic grey scale is used for both images.
Current usage metrics show cumulative count of Article Views (full-text article views including HTML views, PDF and ePub downloads, according to the available data) and Abstracts Views on Vision4Press platform.
Data correspond to usage on the plateform after 2015. The current usage metrics is available 48-96 hours after online publication and is updated daily on week days.
Initial download of the metrics may take a while.