Fig. 6
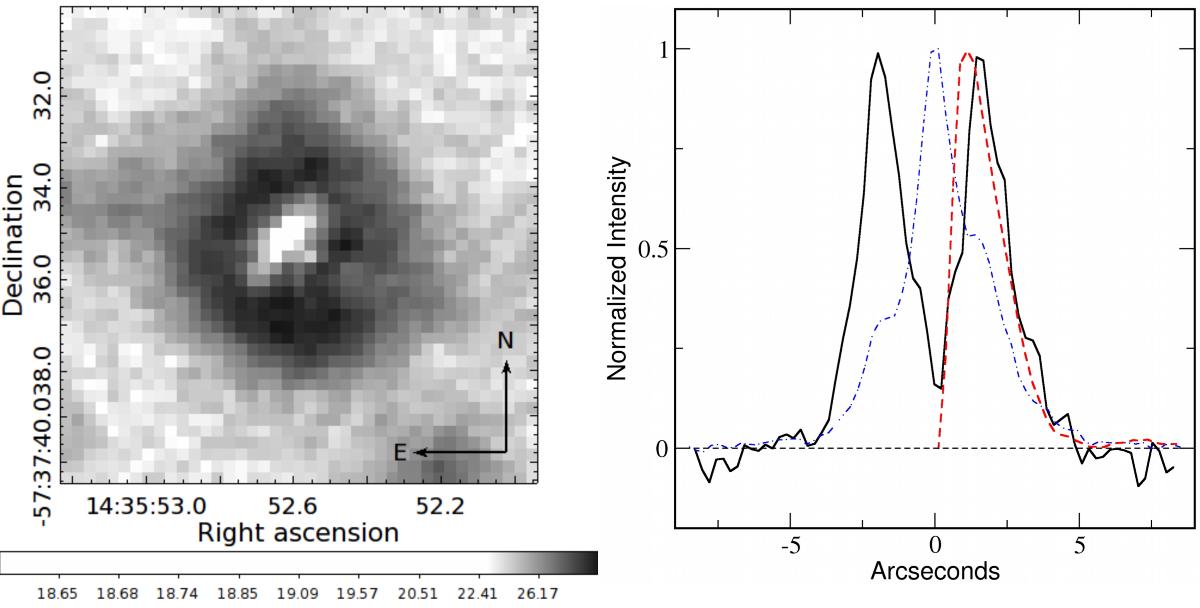
Left: Hα+[N ii] narrow-band image of the V842 Cen extended shell on a logarithmic grey scale. Right: comparison of the radial profile of V842 Cen in the Hα+[N ii] narrow-band image after subtracting the average standard star profile (dashed line) with cross sections averaged perpendicular to the dispersion (±5 Å around the Hα emission line centre) in the long-slit spectrum before (dot-dashed line, Fig. 7 left) and after (continuous line, Fig. 7 right) removing the stellar continuum and the Hα emission line contamination. The profile and the cross sections were normalized to their maxima.
Current usage metrics show cumulative count of Article Views (full-text article views including HTML views, PDF and ePub downloads, according to the available data) and Abstracts Views on Vision4Press platform.
Data correspond to usage on the plateform after 2015. The current usage metrics is available 48-96 hours after online publication and is updated daily on week days.
Initial download of the metrics may take a while.