| Issue |
A&A
Volume 576, April 2015
|
|
|---|---|---|
| Article Number | A60 | |
| Number of page(s) | 19 | |
| Section | Planets and planetary systems | |
| DOI | https://doi.org/10.1051/0004-6361/201424278 | |
| Published online | 27 March 2015 | |
Thermal evolution and sintering of chondritic planetesimals
II. Improved treatment of the compaction process⋆
1
Institut für Theoretische Astrophysik, Zentrum für Astronomie, Universität
Heidelberg, Albert-Ueberle-Str.
2, 69120
Heidelberg,
Germany
e-mail: gail@uni-heidelberg.de
2
Institut für Geowissenschaften, Universität
Heidelberg, Im Neuenheimer Feld
236, 69120
Heidelberg,
Germany
3
Klaus-Tschira-Labor für Kosmochemie, Heidelberg, Im Neuenheimer
Feld 236, 69120
Heidelberg,
Germany
Received: 26 May 2014
Accepted: 15 January 2015
Context. Reconstruction of the thermal history of individual meteorites which can be assigned to the same parent body allows us to derive general characteristics of the parent body, such as its size and formation time, which hold important clues on the planetary formation process. This requires us to construct a detailed model of the heating of such a body by short lived radioactives, in particular by 26Al, and its cooling by heat conduction, which may then be compared to the reconstructed cooling histories of the meteorites.
Aims. The heat conductivity of the material from which planetesimals are composed depends critically on the porosity of the chondritic material. This changes during the process of compaction (also called sintering) of the material at elevated temperatures and pressures. Therefore, compaction of an initially granular material is a key process determining the thermal history of the parent bodies of meteorites. The most realistic modelling of sintering of chondritic material is required.
Methods. The modelling of the compaction process is improved by applying concepts originally developed for the modelling of hot isostatic pressing in metallurgical processes, and by collecting data available from geosciences for the materials of interest. It is extended to a binary mixture of granular components of very different diameters – matrix and chondrules – as observed in chondrites.
Results. By comparison with some published data on sintering experiments it is shown that the algorithm to follow the decrease of porosity of granular material during progressive sintering allows a sufficiently accurate modelling of the compaction of silicate material. The dependence of the compaction process on the nature of the precursor material, either matrix-dominated or chondrule-dominated, is discussed. It is shown that the characteristic temperature at which sintering occurs is different for matrix or chondrule-dominated precursor material. We apply the new method for calculating compaction to the evolution of the parent body of the H chondrites and determine an improved optimised set of model parameters for this body.
Conclusions.
Key words: minor planets, asteroids: general / meteorites, meteors, meteoroids / planets and satellites: physical evolution / solid state: refractory
Appendices are available in electronic form at http://www.aanda.org
© ESO, 2015
1. Introduction
Meteorites preserve in their structure and composition detailed information on the processes operating during the formation of planets from planetesimals, in particular on processes active in the parent bodies of the meteorites. It is possible to recover this information by modelling the structure, composition, and thermal history of meteorite parent bodies and comparing this with results of laboratory investigations of meteorites with regard to their composition and structure. The H chondrite parent body is the most favourable for this purpose for two reasons:
-
First, H chondrites seem to form a family of meteorites with well-defined common properties that hint to a single parent body for all members of this group (e.g. Clayton et al. 1976); it has been argued that (6) Hebe may be the surviving part of this body (Gaffey & Gilbert 1998; Morbidelli et al. 1994; McCausland et al. 2006; Bottke et al. 2010).
-
Second, since H chondrites are the second most frequently found type of chondritic meteorites, many meteorites of this type have been investigated over time and much information is available for them.
To this end, we constructed a model program that calculates the internal structure and thermal evolution of planetesimals of the 10−100 km size class with chondritic composition (Henke et al. 2012a). This model program was then used to reconstruct the properties of the parent body of H chondrites and the most important parameters that governed its thermal evolution (Henke et al. 2012b). It was also used to study whether information on the duration of the growth phase of the parent body can be recovered and it was shown that rapid accretion matches the meteoritic record best (Henke et al. 2013).
The quality of the models depends on the accuracy of the approximations used for modelling the processes that govern the thermal history of the bodies. The most critical ones are the growth history of the bodies, the compaction of the initially porous material, the heat conduction of the porous chondritic material, and the determination of the closure temperature of the different thermochronometric systems used to reconstruct the thermal history of meteorites. The approaches presently used to model such basic processes are not very accurate. Other processes such as heating or interaction with the accretion disk (as long as it exists) are either better known or are of minor influence on the model results.
We aim to improve the treatment of the compaction process for the kind of material encountered in chondrites. This is also the necessary prerequisite for a more accurate treatment of the heat conductivity of the chondritic material, which is planned as the next step.
In our previous papers we modelled the compaction of the porous granular material of asteroids under the action of their self-gravity by a procedure that has already been applied by Yomogida & Matsui (1984) to model the change of porosity of asteroid material during the heat-up phase of their precursor bodies. The same approach was used by other authors to model sintering of ice-free bodies (Akridge et al. 1997; Senshu 2004). This method is based on a theoretical description of hot isostatic pressing (HIP) as proposed by Kakar & Chaklader (1967) and Rao & Chaklader (1972). Hot isostatic pressing is a metallurgical process applied for industrial fabrication of high performance tools from difficult metallic and ceramic materials (e.g. Atkinson & Davis 2000). A more sophisticated method for treating this process has been described by Arzt et al. (1983) and Helle et al. (1985). This model has found many applications for technical processes and was already applied to the problem of sintering of icy planetesimals (Eluszkiewicz 1990). Although all such methods were primarily devised for treating compaction of granular materials at high pressures and temperatures where compaction can be achieved within periods at most of the order of hours, as requested for technical processes, we attempt here to apply the method to the conditions encountered in planetesimals where heating occurs on timescales of the order of hundreds of thousands of years and observable compaction therefore commences at much lower temperatures than in technical processes.
The plan of this paper is as follows. In Sect. 2 we briefly describe the modelling of planetesimal structure. In Sect. 3 we describe the modelling of the compaction of chondritic material by hot isostatic pressing and give a survey of the basic set of equations. In Sect. 4 we present data collected from the literature to be used for modelling, and Sect. 5 compares model results with experimental data. Section 6 contains a parametric study on the compaction of chondritic material, and Sect. 7 considers binary granular mixtures. Section 8 describes our modelling of the parent body of H chondrites using the new sintering algorithm. Section 9 contains some concluding remarks. The Appendices discuss some aspects of two-component granular mixtures of matrix and chondrules.
2. Formation and internal constitution of the parent body
The temperature history of an undifferentiated meteoritic parent body is assumed to be determined by essentially three processes: (i) transient heating by decay of short-lived radioactive nuclei (26Al and 60Fe) and to a lesser extent by long-lasting heating by long-lived radioactives; (ii) transport of heat to the surface by heat conduction; and (iii) energy exchange with the environment by emission and absorption of radiation energy. The efficiency of heat transport in the body is strongly influenced by the material, which is initially porous; the heat conductivity of chondritic material strongly depends on the porosity changes as the body is heated up (e.g. Yomogida & Matsui 1983; Krause et al. 2011; Henke et al. 2012a).
For the formation of the bodies we assume the “instantaneous formation” approximation, i.e. the bodies are assumed to acquire most of their mass during a period of at most a few 105 years. Present planetary formation scenarios suggest such rapid mass acquisition of 100 km sized and bigger bodies (e.g. Weidenschilling & Cuzzi 2006; Nagasawa et al. 2007; Weidenschilling 2011), and the modelling showed that the cooling history of H chondrites is only compatible with formation times ≲0.3 Ma (Henke et al. 2013; Monnereau et al. 2013). The rapid growth is approximated by the assumption that the bodies came into life at some instant tform and have constant mass over their whole subsequent evolution.
The shape and internal structure of the body is assumed to be spherically symmetric. It is assumed that the granular material is already pre-compacted by cold compression to such an extent that no significant further particle rearrangement by mutual rolling and gliding of the granular units is possible (see Henke et al. 2012a). The only kind of motion is the shrinking of the body by sintering. The initial state of the material is a granular medium with filling factor D (=volume fraction filled with solids, related to porosity by D = 1 − φ) with a constant initial value of D in the body.
In detail, the following equations are solved:
-
1.
the equation for the hydrostatic equilibrium of the solid component to calculate the lithostatic pressure p in the body;
-
2.
an analogous equation for the hydrostatic pressure pg of the gas filling the voids. This equation is solved as long as the pore space in the granular material remains interconnected. After closure of pore space at some critical filling factor, Dc, the gas pressure in pores has to be determined in a different way (see Eq. (6)). As the pore space shrinks during compaction, part of the pore-filling gas is squeezed out of the body. This outgassing as D approaches Dc is not considered in our model because this has no influence on the compaction process;
-
3.
the heat conduction equation for the evolution of the temperature. The heat conductivity used in our model depends on the porosity φ = 1 − D of the material. We use the analytic fit
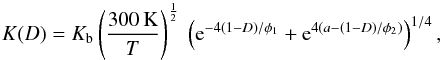 (1)where φ1 = 0.08,
φ2 =
0.167, and a = −1.1 are constants given in Henke et al. (2012a). The pre-factor
Kb corresponds to the heat
conductivity of the bulk material (i.e. at D = 1) at room temperature. The temperature
dependence is as proposed by Xu et al. (2004);
(1)where φ1 = 0.08,
φ2 =
0.167, and a = −1.1 are constants given in Henke et al. (2012a). The pre-factor
Kb corresponds to the heat
conductivity of the bulk material (i.e. at D = 1) at room temperature. The temperature
dependence is as proposed by Xu et al. (2004);
-
4.
a set of equations for the sintering of the initially porous material under the influence of pressure and elevated temperature
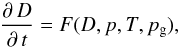 (2)where the right-hand side is determined
by solving a set of equations for the specific sintering model. These equations are
discussed in detail in Sect. 3.
(2)where the right-hand side is determined
by solving a set of equations for the specific sintering model. These equations are
discussed in detail in Sect. 3.
3. Modelling the sintering process
3.1. The basic assumptions
A method for predicting compaction of granular materials by HIP that has found many applications in modelling technical processes was proposed by Arzt et al. (1983). An improved version is given in Helle et al. (1985). This model will be applied in the following to the problem of compaction of chondritic material.
In the derivation of the model of Helle et al. (1985) it is assumed that the granular material initially consists of closely packed equal sized spheres. This special assumption is, however, not an irrevocable condition for its applicability, but mainly serves to define a relation between the filling factor D and the average number of contacts between a granular unit to its neighbours for a granular medium initially packed with a significant degree of porosity (i.e. a material that does not have a special gradation of particle sizes chosen such as to achieve high filling factors as in the case of concrete). In technical applications, the model of Helle et al. (1985) is applied successfully to granular materials that have some range of particle sizes.
The structure of chondritic material to which we aim to apply the theory seems to be compatible with this. The material of chondritic meteorites of low petrologic type consists of essentially spherical chondrules of ≈0.3 mm (H chondrites) or ≈0.5 mm (L chondrites) diameter. They are partially glassy mineral beads of mainly olivine and orthopyroxene composition (e.g. Scott 2007). The chondrules vary in size, but strong deviations from the mean seem to be rare. The assumption of the model, a packing of spherical particles from a limited size range as initial configuration, seems to be reasonably well fulfilled by the chondritic material.
The voids in between the chondrules are partially filled with very fine dust particles (with sizes 0.01 to 1 μm) with a total volume filling factor of 10...15 Vol% (e.g. Scott 2007), i.e. initially the voids between chondrules are essentially empty. The presence of this small amount of dust can probably be neglected when calculating the compaction (see Sect. 6.2).
The model of Helle et al. (1985) assumes that there are no gross particle rearrangements by mutual rolling and gliding of particles in the granular material during the compaction process. Particle rearrangements (or granular flow) are responsible for compaction of loose powders with low filling factors. The particles of a granular material become essentially immobile if the filling factor approaches a value of D0 ≈ 0.56. This is the loosest packing that is just stable under the application of a weak external force (Onoda & Liniger 1990; Jaeger & Nagel 1992; Güttler et al. 2009) and has on the average Z ≈ 6.6 contacts with neighbours. The value of D0 = 0.56 therefore is the lowest initial filling factor for which particle rearrangement is not important for compaction. According to our former calculations (Henke et al. 2012a) this degree of compaction is already achieved by cold pressing under the action of self-gravity for planetesimals of 10 km in size.
In technical HIP processes, however, one starts with a pre-compacted granular material with a higher initial filling factor D0. This initial value is usually taken to be D0 = 0.64 which corresponds to the random closest packing of equal sized spheres (Scott 1962; Jaeger & Nagel 1992). The average number of contacts to neighbours is ≈7.3 in this kind of packing. This filling factor can be achieved by tapping or joggling the less compacted material with 0.56 <D< 0.64. In an application to the problem of chondrite parent bodies the initial condition may be different because of a different evolution history. None of the equations or approximations given by Helle et al. (1985) depends on the specific value of D0 assumed by them, so we can use all the equations even with a value of D0 different from their standard value of 0.64.
The compaction is assumed to proceed by a two-stage process. During stage 1 the granular particles are deformed and squeezed together. They develop flat contact areas of increasing diameter between particles while the pores between particles shrink in size but still form an interconnected network that connects each pore to the surface of the body. During this stage the gas pressure within the pores remains at about the ambient pressure. At some critical filling density, Dc, pores close and further compaction during stage 2 proceeds by reduction of isolated spherical pores embedded in the material. The gas pressure in the pores then increases as their size shrinks. Two sets of equations are given, one for the compaction during stage 1, and one for the disappearance of voids during stage 2. In the model of Helle et al. (1985) the modelling switches between equations for stage 1 and stage 2 at a filling density of Dc = 0.9.
3.2. Mechanisms
The compaction under the action of high pressure and/or elevated temperature is due to a
number of different processes. Helle et al. (1985)
give approximate equations for the compaction rate dD/dt for a number of
processes, believed to be the most important ones for real HIP processes. The different
processes operate essentially independent of each other and, therefore, the total
compaction rate is the sum of the contributions of several processes 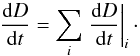 (3)In the following we give for convenience a
brief overview of the approximate rate equations for the different processes proposed by
Helle et al. (1985).
(3)In the following we give for convenience a
brief overview of the approximate rate equations for the different processes proposed by
Helle et al. (1985).
Before the onset of deformation, the particles have a radius G (grain radius), the initial filling factor before HIP is D0. The external pressure acting on the granular particles is p, the gas pressure in the pores before closure is pg. All temperatures are in Kelvin.
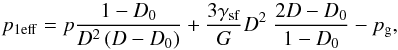
3.2.1. Effective pressure acting on grains
The effective pressure acting on the contact areas between grains is given by the external pressure p, corrected for its transmission to the small contact areas between grains, and by contributions of the surface tension of particles, γsf, and the gas pressure in the pores:
Stage 2: 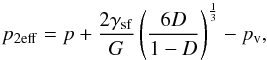 (5)with
 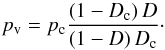 (6)Here, pc is the gas
pressure in the pores, pg at the instant of closure of pore
network, pv the pressure in the isolated pores
after closure of pore network, and Dc the filling factor at which closure
occurs. These expressions are the corresponding equations from Arzt et al. (1983, Eqs. (7) and (10)), modified by the approximations
in Helle et al. (1985). In the latter paper the
gas pressure in pores is neglected because in technical processes the material is
usually out-gassed before starting HIP and applied pressures p are rather high, an
assumption that may not be applicable to the case of planetesimals because of the
generally lower applied external pressures p.
(6)Here, pc is the gas
pressure in the pores, pg at the instant of closure of pore
network, pv the pressure in the isolated pores
after closure of pore network, and Dc the filling factor at which closure
occurs. These expressions are the corresponding equations from Arzt et al. (1983, Eqs. (7) and (10)), modified by the approximations
in Helle et al. (1985). In the latter paper the
gas pressure in pores is neglected because in technical processes the material is
usually out-gassed before starting HIP and applied pressures p are rather high, an
assumption that may not be applicable to the case of planetesimals because of the
generally lower applied external pressures p.
In the model calculations p and pg are determined by the solution of hydrostatic pressure equations for the solid granular material and for the pore gas, respectively.
3.2.2. Power-law creep
If contact zones between particles are deformed by dislocation creep, the strain rate
 and stress σ are empirically related by
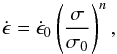 with empirically to be determined
quantities
with empirically to be determined
quantities  ,
σ0, and n. The stress
σ is the
effective pressure, peff, acting at the particle contacts.
Defining the abbreviation
,
σ0, and n. The stress
σ is the
effective pressure, peff, acting at the particle contacts.
Defining the abbreviation  (7)the deformation rate by power-law creep is
(Helle et al. 1985, Eqs. (23) and (24)):
(7)the deformation rate by power-law creep is
(Helle et al. 1985, Eqs. (23) and (24)):
Stage 1: 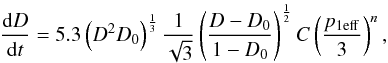 (8)Stage 2:
 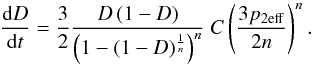 (9)These are differential equations for
D(t) to be solved in that region
of parameter space where power-law creep is responsible for compaction.
(9)These are differential equations for
D(t) to be solved in that region
of parameter space where power-law creep is responsible for compaction.
3.2.3. Volume diffusion
Another mode of shrinking the volume of a granular mixture is the diffusion of material away from the contact area to the grain surfaces adjacent to pores, upon which pore volume shrinks and the filling factor D increases. The diffusion may occur through the grain volume or along grain surfaces adjacent to pores. The diffusion coefficients are temperature dependent.
The deformation rate by volume diffusion is (Helle et al. 1985, Eqs. (19) and (20)):
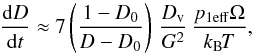
Stage 2: 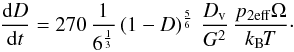 (11)Here Ω is the atomic volume of the diffusing
atom and Dv is the diffusion coefficient of
volume diffusion. These are material constants.
(11)Here Ω is the atomic volume of the diffusing
atom and Dv is the diffusion coefficient of
volume diffusion. These are material constants.
3.2.4. Boundary diffusion
The deformation rate by boundary diffusion is (Helle et al. 1985, Eqs. (19) and (21)):
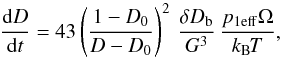
Stage 2: 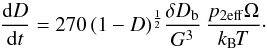 (13)The quantity δDb is the diffusion
coefficient of boundary diffusion.
(13)The quantity δDb is the diffusion
coefficient of boundary diffusion.
4. Data
The coefficients required for modelling compaction by HIP have been determined for a number of technically important materials, and published data can be found in the literature. A collection of such data is presented by e.g. Frost & Ashby (1982)1, and Arzt et al. (1983).
The chondrules and the matrix of the chondritic material are mainly composed of olivine (Mg2xFe2(1−x)SiO4) and pyroxene (MgxFe(1−x)SiO3) in varying quantities and varying iron contents, x, and some additional minor components, in particular metallic iron or troilite. Data required for modelling the compaction process for such a complex material have never been determined, but a number of studies have been performed for almost pure olivines and pyroxenes because of their relevance in geophysics. Because of the lack of other data we use these data for modelling HIP of chondrules.
The coefficients entering the equations are usually approximated by physically motivated analytic expressions depending on some empirically to be determined constants. The kind of approximations used is different in the work of Arzt et al. (1983), Helle et al. (1985), and in geosciences.
Numerical values of the coefficients describing material properties for some materials of interest in SI units, temperatures in K.
4.1. Approximations as used in Helle et al.
The ratio C
defined by Eq. (7) is related to the shear
modulus, μ,
the volume diffusion constant, Dv, and the Burgers vector,
b, via (see
e.g. Arzt et al. 1983)
 (14)where A is a constant and
Dv and μ, are temperature
dependent:
(14)where A is a constant and
Dv and μ, are temperature
dependent: 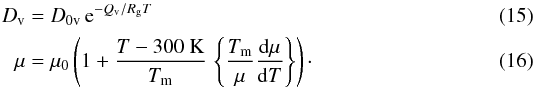 Here Tm is the
melting temperature. The quantities A, D0v, Qv,
μ0, and
Here Tm is the
melting temperature. The quantities A, D0v, Qv,
μ0, and
 are material constants, and
Rg is the gas constant. The quantity
δDb is given by the
approximation
are material constants, and
Rg is the gas constant. The quantity
δDb is given by the
approximation 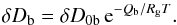 (17)The quantities δD0b and Qb are also
material constants. For convenience, numerical values as used in this paper for all the
coefficients entering these relations are given in Table 1 for olivine (from San Carlos) and corundum.
(17)The quantities δD0b and Qb are also
material constants. For convenience, numerical values as used in this paper for all the
coefficients entering these relations are given in Table 1 for olivine (from San Carlos) and corundum.
Though alumina compounds are found in calcium-aluminium-rich inclusions (CAIs), they are not an important component in chondritic material. There is a possibility, however, that in the innermost part of the solar nebula there were planetesimals formed exclusively from refractory Ca-Al-bearing mineral compounds.
4.2. Approximations used in geosciences
An alternative approximation for C generally used in geosciences is  (18)where G is the average radius of
the granular units. This kind of approximation is used both for power-law creep and for
diffusional deformation.
(18)where G is the average radius of
the granular units. This kind of approximation is used both for power-law creep and for
diffusional deformation.
The constants A, b, and Q have to be determined empirically. Since the rheological properties of silicates strongly depend on their water content, one can find results for experiments performed under dry or wet conditions. We are only interested in results that are claimed to correspond to dry conditions since there are no indications that the parent bodies of the ordinary chondrites contained water. Finally, experiments are conducted for single crystals or for polycrystalline material. For our purposes data for polycrystalline materials are probably the more useful ones for the type of calculations we perform. The literature has been searched for experimental data for olivine and pyroxene and the most recent data found are given in Table 2. We note that the stress in this case is in units of bars.
Literature data for experimental determinations of rheological data parametrised in
the form  for dry olivines and pyroxenes.
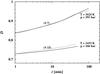 |
Fig. 1 Comparison of laboratory hot pressing measurements at fixed p and T (shown at the curves) for San Carlos olivine granular material from Schwenn & Goetze (1978; dashed line) and results of a model calculation using coefficients given in Table 1 (full lines). The particle size is between 0.25 and 0.5 mm in sample S7 and between 0.5 and 1 mm in sample S15. The pressure and temperature conditions are such that sintering proceeds via power-law creep. |
Granular components and some properties of chondrite groups.
5. Comparison with experimental results
Schwenn & Goetze (1978) have published some data on the densification curves D(t) for experiments on the compaction of olivine (San Carlos, Fo92) by HIP at a number of pressures, temperatures, and particle sizes. We can compare these experimental results with numerical model calculations based on the model equations from Sect. 3 and the material parameters from Table 1. Two runs from the set of measurements are made for particle sizes of the same order of magnitude as chondrule sizes (experimental runs S7 and S15 of Schwenn & Goetze 1978). The pressures are also comparable to the central pressure of 100 km sized planetesimals. These measurements are particularly suited to check if the model of Helle et al. (1985) describes the compaction behaviour of chondritic material reasonably well.
We read off the variation of D with time from Fig. 3 of Schwenn & Goetze (1978). Unfortunately, the initial part of the evolution during the first minute is not shown and no information on this is given elsewhere in the paper, which means that we have no information on the initial state when the sample was subjected to pressure loading. Therefore, we solved the differential equation for D(t) with arbitrary initial value D(0) and varied this until the value of D(t) at t = 1 min equals the value shown in Schwenn & Goetze (1978).
Figure 1 shows the densification curves D(t) of the experiments and the numerical results for D(t) calculated for the pressure, temperature, and average particle size of the experiments. The theoretical model reproduces the experimental results with sufficient accuracy such that it can be assumed that the HIP model of Helle et al. (1985) is applicable to the compaction of chondritic material.
The coefficients for power-law creep and diffusion used in the calculation are determined for materials that are thought to be analogues of upper earth mantle materials. The mineral composition of chondritic material is to some extent similar to this, but not the same. It would be desirable to determine the necessary data directly for chondritic material.
6. Sintering behaviour of chondritic planetesimals
The compaction process for the granular material in planetesimals can be roughly conceived as a two-stage process. During the initial phase when planetesimals grow, the temperature of the material does not change very much. The characteristic timescale for heating the material by radioactive decay of 26Al is of the order of t1 / 2 = 7.2 × 10⁵ a 2. This lasts much longer than the expected growth times of the bodies (<105 a, see Henke et al. 2013). Therefore, one can separate the compaction process of planetesimal material into two phases:
-
First, compaction proceeds at constant temperature and increasing pressure (cold isostatic pressing).
-
Later, compaction proceeds at constant pressure and increasing temperature (HIP).
The first stage can be treated as is outlined in Henke et al. (2012a). This is not considered further. Here we aim to consider the second stage on the basis of the theory of Helle et al. (1985).
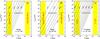 |
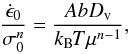
Fig. 2 Variation of compaction timescale, tcomp, with grain radius G for sintering a granular material of olivine and corundum beads from D = 0.64 to D = 0.90 at different temperatures for different pressures. Also indicated are the characteristic sizes of chondrules, matrix, and dust particles in the solar nebula. |
6.1. Nature of the material
We consider only dry planetesimals from the zone inside the snow-line in the solar nebula where ordinary chondrites come from. The dominating material of the planetesimals are silicate compounds with an admixture of many minor components like metallic iron and Ca-Al-bearing compounds. We concentrate here on the dominating silicate compounds. We also consider corundum because in the innermost hot zone of the solar nebula there could once have existed planetesimals consisting mainly of this material.
Prior to compaction, the size of the different components of the granular material forming the parent bodies of ordinary chondrites is very different. On the one hand there is fine-grained matrix material with particle sizes with a wide range of diameters up to a few μm on the other hand there are chondrules with a rather narrow range of diameters, 0.3−0.5 mm. Table 3 gives an overview on the main components of the granular material of chondrites (see also Scott 2007). For ordinary chondrites the volume filling factor by the chondrules in the meteorites, 0.6 to 0.8, is high and by the fine-grained matrix in the meteorites is relatively small, 0.1 to 0.15. This matrix volume filling factor of matrix material is significantly less than the void fraction of the uncompacted material, i.e. initially the matrix material could not have completely filled the voids between the chondrules. This means that the initial structure of the material prior to compaction must have been such that the chondrules are mainly in direct contact with each other and that the fine-grained matrix material filled only part of the void space between chondrules. In some cases some matrix material is found as thin coatings on the chondrules; in such cases the chondrule-chondrule contact is mediated by a thin matrix film in between. Hence, if we model compaction of chondritic material by HIP we have to start with a dense packing of almost equal sized and almost spherical chondrules. The question of what happens with the matrix comes into play only after a substantial reduction of void space.
For carbonaceous chondrites one has to consider the opposite case that the fine-grained matrix material is the dominating component and chondrules are interspersed in this material. The volume filling factor of the chondrules is between almost zero and at most 0.5, which means that their filling factor stays below the critical value of 0.56 where each particle has contact with about six neighbours and the packing of chondrules becomes immobile (Onoda & Liniger 1990; Jaeger & Nagel 1992; Güttler et al. 2009); in most cases the filling factor is well below this value and the number of direct contacts between chondrules is small. The space between the chondrules is filled with matrix and the sintering by hot isostatic pressing is ruled by contacts between the tiny matrix grains. A corresponding kind of matrix-dominated material seems not to have been found for any dry ordinary chondrite (cf. Table 3), except for the rare K chondrites (Kakangari grouplet).
Therefore, it is only necessary to consider with respect to sintering the two limit cases of a coarse-grained chondrule material or a very fine-grained matrix material. Only the case of the CR and CO chondrites is just at the transition and probably requires a more refined treatment. All other cases can be treated by one of the limit cases.
Appendix A discusses in more detail the chondrule-matrix mixture, specifically how the effective porosity of such a material can be calculated. This is compared in Table 3 with empirically determined average porosities of meteoritic groups (Consolmagno et al. 2008). The theoretical predictions roughly agree with what one observes for the clan of carbonaceous chondrites. For ordinary chondrites the results are discordant, probably because most of the meteorites that were investigated are already partially sintered. The effective porosity derived in Appendix A determines the initial porosity which has to be used in calculating a thermal evolution model.
6.2. Compaction timescale
By solving the differential Eq. (3) between an arbitrarily chosen initial value of D = 0.64 and final value of D = 0.90 we determine a characteristic timescale required for almost complete compaction of chondritic material. In particular we intend to study the dependence of the compaction time on granular particle radius G. We did the calculations for two pressures and a set of temperatures. The results are shown in Fig. 2 for olivine and alumina particles.
6.2.1. Olivine
Figure 2a holds for particles on the surface of planetesimals (p = 10-3 bar). The compaction process is completely dominated by surface diffusion in this case and is strongly radius dependent. Particle aggregates of chondrule-sized particles will obviously not be affected by diffusional compaction at the temperatures relevant in the outer mantle of planetesimals. The fine-grained dust material, however, will rapidly coalesce to a compact material at temperatures above about 700 K. Fine-grained olivine dust material can only survive at temperatures below this temperature.
This also holds for free floating dust aggregates in the accretion disk. Only in the disk regions with temperatures T ≲ 700 K can fine-grained dust agglomerates exist that are thought to form the initial stage of the growth process from dust to planetesimals.
Figure 2b holds for particles in the core region of about 100 km sized bodies (p ≈ 102 bar). For the small matrix particles, compaction is dominated by diffusion. For chondrules, however, the compaction mechanism turns to power-law creep which is size independent. This corresponds to the horizontal part of the curves.
Two points are evident from the figure. First, the granular material coalesces to a compact material at a temperature where the heating timescale (by 26Al decay) equals the compaction timescale. For parent bodies of chondrites the heating timescale is typically of the order of 1 Ma. Compaction then happens at a temperature between 650 and 700 K for matrix material and proceeds via surface diffusion. For the chondrules compaction at the assumed pressure occurs at a temperature somewhat higher than 900 K and proceeds via dislocation creep. Hence the compaction of chondritic material consisting of chondrules and matrix material occurs in two steps at two different temperatures.
This has an obvious consequence. Since the matrix material has basically the same composition as the chondrule material, this means that by surface diffusion the fine-grained matrix material adds to the surface of chondrules and somewhat increases their size. One therefore expects that at temperatures above about 700 K, but below the temperature where sintering by power-law creep commences, a chondrule-dominated material looks like a material already slightly sintered by hot pressing.
With respect to the modelling of the HIP of ordinary chondrite material this means that we can simply add the small fraction of matrix material to the chondrules and perform the calculation for a modified coarse-grained granular material without a matrix component. This assertion in principle requires a verification by experiment or by a model calculation for this process that would be quite cumbersome, but even without this verification it is physically obvious that the assertion is true.
6.2.2. Alumina
Alumina grains exist in the hot inner region of the solar nebula where no iron and silicates exist. The compaction process is completely dominated by surface diffusion and is strongly radius dependent (Fig. 2c). Particle aggregates of the typical size of CAIs will obviously not be affected by diffusional compaction at the temperatures relevant in the outer mantle of planetesimals in this region. The fine-grained dust material, however, will rapidly coalesce to a compact material at temperatures above about 900 K. Fine-grained alumina dust material can only survive at temperatures below of this temperature.
7. Sintering of a matrix-chondrule mixture
The material of the least metamorphosed chondrites, the petrologic type 3, is a binary mixture of very fine-grained matrix material and the coarse-grained granular material of chondrules. Such material is thought to represent the initial structure of the material from which the parent bodies of the chondrites formed before it is converted at elevated temperatures and pressures to the kind of material seen in the other petrologic types. We discuss here how the sintering of such a binary mixture of dust and chondrules can be calculated. The discussion is limited to ordinary chondrites. Carbonaceous chondrites are not considered because of their significantly different composition due to aqueous alteration.
7.1. Matrix-chondrule mixture
The mixture of the ordinary chondrites is strongly dominated by the chondrules, except for meteorites from the rare Kakangari grouplet where the mixture is strongly dominated by the fine-grained matrix material with a small contribution by interspersed chondrules. In both cases the ratio of chondrule diameter (typically 500 μm) to the diameter of matrix particles (of order 1 μm) is very large. In Appendix A some properties of such a binary matrix-chondrule mixture with very different particle diameters of the two components are discussed and it is found that the varying properties of the initial state are ruled by the quantity fma which is defined as the fraction of volume filled with matrix material to the sum of the fractions of volume filled with matrix and chondrule material (not including the pore space). By definition 0 ≤ fma ≤ 1; pure chondrule material corresponds to fma = 0, pure matrix material to fma = 1. Table 3 shows estimates of this quantity for the different chondritic meteorite groups. For the ordinary non-carbonaceous chondrites the parameter fma takes small values, except for the K meteorites where fma is large. As examples we consider the two cases fma = 0.1 of a chondrule dominated material as observed in the case of ordinary chondrites and fma = 0.75 of a matrix dominated material as observed in the case of Kakangari.
In Appendix B it is shown that with respect to sintering one has to consider three different cases, depending on the value of fma. For the two examples we intend to consider, the sintering process is essentially a one-step process where the overall behaviour of the mixture is either determined by the sintering of chondrules (fma ≤ ftran = 0.265) or by the sintering of the matrix (fma ≥ fstop = 0.444). An intermediate two-step case that depends both on sintering of chondrules and matrix is not considered because this seems not to be realised for ordinary chondrites.
In Appendix A the effective porosity of the binary mixture is derived. It depends on the mixing ratio fma and on the initial filling factors. Table 3 shows values for the effective porosity calculated from the relations in Appendix A for the different meteoritic groups from their typical value of fma and a value of the initial porosity of φ ≈ 0.36. The calculated values are compared with typical observed values of the porosity. The theoretical values for carbonaceous chondrites are of the same order as the observed values. The observed porosity of the ordinary chondrites, however, is too small to be compatible with an un-sintered material; for most such meteorites the material seems to be already compacted to some extent.
7.2. Sintering of the mixed material
Because of the big size difference of matrix particles and chondrules, one infers from the discussions in Sect. 6 that sintering of the pure matrix or pure chondrule material occurs at two significantly different temperatures (see Fig. 2): at a temperature between 700 and 750 K for the fine-grained matrix material and at about 950 K for the chondrule material. The sintering process of the mixture is therefore expected to occur in two steps in two different temperature regimes. Table 3 shows estimates of the maximum temperatures reached by the different meteorite types derived from mineralogical considerations. The high maximum temperatures achieved by ordinary chondrites suffice for a complete compaction of the chondrule material as predicted by the sintering model, consistent with the properties of the highest petrologic grade 6 observed for the ordinary chondrites. For the matrix dominated carbonaceous chondrites from the CI, CM, and CR group the maximum temperatures stay below the temperature required for the sintering of the matrix material according to the sintering model, also consistent with the observation of low petrologic grades of these meteorites. For the CO and CV group, maximum temperatures are sufficient for compaction of the matrix, but not for compaction of chondrule material. These two groups fall into the intermediate case which is neither chondrule nor matrix dominated and shows a complicated sintering behaviour not discussed here. For the group CK the material is matrix dominated and the maximum temperatures are sufficiently high for the sintering of both the matrix and chondrule components according to our sintering model, consistent with the highest petrologic grade 6 observed for this group. In this respect the sintering model is qualitatively in agreement with observed properties of the meteorite groups.
7.2.1. Matrix-dominated material
In this case, the chondrules interspersed in the matrix material act essentially as a passive element that lowers the porosity of the mixed material compared to the case of a pure matrix material because they fill part of the volume but do not contribute to the pore volume. The mixture can be treated as a single-component case of pure fine-grained matrix material, with only two exceptions.
First, one has to use the effective porosity φeff = 1 − Deff, with Deff given by Eq. (B.2), in the expression for the heat conductivity of the porous material, Eq. (1). The filling factor of the matrix material, Dma, is calculated by solving the differential Eq. (3) for Dma. As initial value for Dma one chooses the filling factor of the random closest packing (see Appendix A).
Second, one has to calculate the total mass density of the mixture from
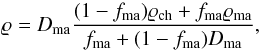 (19)where ϱch and
ϱma are the bulk density of the
chondrule and the matrix material, respectively.
(19)where ϱch and
ϱma are the bulk density of the
chondrule and the matrix material, respectively.
All other details of the model computation are the same as in Henke et al. (2012a,b). Once the matrix component is completely compacted, no further compaction of the whole material is possible. The total compaction in the case considered here occurs at the characteristic temperature of matrix compaction.
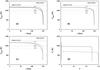 |
Fig. 3 Variation of maximum temperature in a mass element at radial position r. The radius r is the final position of the mass element after sintering of the body has finished. a) Chondrule dominated material with olivine composition. Solid line: sinter algorithm according to Helle, rheological constants from Table 1. Dotted line: sinter algorithm according to Helle, rheological constants from Table 2. Long dashed line: sinter algorithm according to Chaklader, rheological constants as in Henke et al. (2012b). Short dashed line: sinter algorithm according to Chaklader, rheological constants from Table 2. b) Chondrule dominated material, sinter algorithm according to Helle. Solid line: enstatite composition. Dashed line: olivine composition. c) Matrix dominated material, sinter algorithm according to Helle (solid line). For comparison, the dashed line corresponds to a model with chondrule-dominated material. d) Evolution of porosity φ with central temperature Tc. Solid line: chondrule-dominated material. Dashed line: matrix-dominated material. The horizontal dashed lines in images a) to c) indicate the transition temperatures between different petrologic types according to McSween et al. (1988) and the solidus temperatures of the Fe, Ni-FeS complex and the chondritic silicate-mixture. |
7.2.2. Chondrule-dominated material
For the chondrule dominated material the properties of the mixed material are essentially determined by the packing of chondrules. The matrix fills the voids left between the chondrules. Because this matrix has not yet reached the highest stage of compaction possible without sintering, we assume that the lithostatic pressure only acts on the contacts between chondrules, and that the effective pressure, given by Eq. (4) or Eq. (5), acting on the matrix particles in the voids between chondrules is determined only by the pressure of the pore gas and the contribution of surface tension.
The matrix sinters by surface diffusion because of the small diameter of its granular components in a temperature range much lower than that where sintering of chondrules by dislocation creep commences. During sintering of the matrix the total void space in the space between the chondrules does not change; it is only re-distributed. The effective packing fraction during this phase is given by Eq. (A.7).
After complete sintering of the matrix material this material is probably attached to
the surface of the former chondrules such that the structure of the material at that
stage resembles an already slightly pre-compacted material with a filling factor given
by Eq. (A.7). Further compaction of the
material then can be treated as compaction of the chondrule component described by Eq.
(3) subject to initial condition (A.7) and an increased diameter of the
granular elements  (20)where G is the initial radius
of the chondrules.
(20)where G is the initial radius
of the chondrules.
For the chondrule dominated material it suffices therefore to solve an equation of the
type (3) for the filling factor
Dch of chondrules with initial condition
(A.7) and a modified radius
 .
.
Parameters for the planetesimal model.
7.3. Sample models
As an example we consider thermal evolution models (in the instantaneous formation approximation) including sintering of a planetesimal for an arbitrarily chosen test case similar to our best-fit models in Henke et al. (2012b, 2013) for the H chondrite parent body. The general parameters of the planetesimal are given in Table 4 which are chosen following Henke et al. (2012b). We calculated models for the chondrule dominated case and for the matrix dominated case based on the theory of HIP of Helle et al. (1985). For comparison we also calculated models for the same set of parameters for the body with the theory for HIP of Chaklader (Kakar & Chaklader 1967; Rao & Chaklader 1972).
The equations are integrated from the formation time tform of the body for a period of 4.5 Ga. The initial radius of the body is chosen such that after complete compaction its radius would be equal to the value given in Table 4. This radius is not completely arrived at after completion of sintering because some residual porous surface layer remains in all cases. This is the layer where temperatures remain too low for significant sintering.
7.3.1. Chondrule-dominated material
Figure 3a shows the resulting maximum temperature achieved in some mass element during the whole time evolution. The mass element is characterised by its radial distance r at the end of the calculation, i.e. its final position after compaction has terminated, since at an age of 4.5 Ga temperatures are too low throughout the body for further shrinking by sintering. The maximum temperature Tmax(r) is of particular interest because it determines the degree of metamorphism that the material suffered during the evolution. The figure also shows the transition temperatures between petrologic types as defined in McSween et al. (1988) and the limits for the onset of melting of Fe, Ni-FeS and of the chondritic silicate mixture. From this we can immediately see the radial range of depths below the surface of the body where meteorites of petrologic types 3 to 6 come from.
The solid line shows the run of maximum temperature for the case that the quantity C from Eq. (7) is calculated as described by Arzt et al. (1983) with data from Table 1. The dotted line shows the result if the quantity C is calculated using the fit for the deformation rate, Eq. (18), using constants for olivine shown in Table 2. The resulting distribution Tmax(r) is almost identical. Both variants of calculating the deformation rate by power-law creep obviously provide the same model results.
The dotted long dashed and short dashed lines show the corresponding results if sintering is calculated by the method of Chaklader as described in Henke et al. (2012a). The long dashed line corresponds to a model where the quantity C is calculated using data for olivine from Schwenn & Goetze (1978). The short dashed line uses data for olivine from Table 2. The resulting distributions Tmax(r) in both cases are almost identical. There is, however, a significant difference between the temperature structures calculated from the descriptions of HIP by the model equations of Helle et al. (1985) and of Rao & Chaklader (1972).
Figure 3b compares the resulting maximum temperature achieved in some mass element during the whole time evolution for two different compositions of chondritic material. The solid line shows a model where it is assumed that the granular material is dominated by enstatite, using data from Table 2. This is appropriate for the case of enstatite chondrites. For comparison the dashed line shows the corresponding model using data for olivine. The two models show a slightly different temperature structure at high temperatures because enstatite starts sintering only at higher temperature than olivine because of its higher resistivity against creep deformation making the residual porous outer layer for enstatite-dominated chondritic material slightly thicker than for olivine-dominated chondritic material. On the whole, however, the two models are similar such that one does not expect big differences in the temperature evolution of the parent bodies of enstatite chondrites versus parent bodies of H and L chondrites resulting from their different mineral composition.
Cooling ages and closure temperatures of H-chondrites used in this study.
7.3.2. Matrix-dominated material
A model with matrix dominated material is calculated using model parameters as defined in Table 4. The initial size of matrix particles in meteorites is not known. The matrix material seen in chondrites of petrologic type 3 was already subject to Ostwald ripening, such that its typical size of several μm is not representative for the initial state. Probably the particle sizes of typically ≲0.1 μm of the small particles in cluster IDPs that are thought to originate from comets are more close to what could be the initial size of matrix particles. The choice in Table 4 of a size for the granular units of the matrix material is rather arbitrary but is within the range of possible values.
The sintering is calculated by using data for olivine from Table 1. Test calculations have shown that volume diffusion (see Sect. 3.2.3) is always much less important than surface diffusion and is neglected therefore. Figure 3c shows for the model the resulting maximum temperature achieved in some mass element. For comparison also the model for chondrule-dominated material with olivine composition is shown. The temperature evolution for bodies with matrix-dominated and chondrule dominated material are substantially different because of the large difference of the temperature required for efficient sintering.
The temperature at which sintering occurs can be seen from Fig. 3d where the temperature at the centre, Tc, is plotted versus porosity. The initial porosity corresponds to the right lower end of the curves. During the thermal evolution the temperature first rises at constant porosity until at a certain temperature level the activation energy barriers for creep or diffusion can be surmounted. The porosity then decreases within a narrow temperature interval to almost zero. The central temperature then first continues to increase, but later decreases at zero porosity, because the heat sources become exhausted. The characteristic temperatures for rapid sintering are 680 K for the matrix-dominated material and 960 K for the chondrule dominated material.
8. Application to sintering of planetesimals
As an application of the method for modelling compaction of a chondrule-dominated material we consider the thermal evolution of the parent body of the H chondrites.
8.1. Model calculations
The model calculation of the internal constitution and thermal evolution is essentially identical to the model calculation as described in Henke et al. (2012a), except that now two equations are solved, an equation for the gas pressure in the pore space before closure of the pore network, and Eq. (6) after closure. The initial condition psrf for the gas pressure at the surface is the pressure in the accretion disk for which we chose the approximate value given in Table 6 (see Fig. 1b in Henke et al. 2012a).
The model depends on a number of parameters that refer to the properties and composition of the material from which the planetesimal formed or are determined by specific properties of the material of the solar nebula. We choose these parameters as discussed in Henke et al. (2012a,b). Their values are given in Table 6 under the heading “Parameters” (and also in Table 4). For the properties of the chondrule-matrix mixture we use the same parameters as those given in Table 4 for the chondrule-dominated case because they are already tailored for the H chondrite parent body.
Parameters for optimised models of the parent body of H chondrites for chondrule-dominated binary granular mixture based on the theories of sintering by Helle et al. (1985; model H) or Rao & Chaklader (1972; models R and Rp).
Specific parameters of the model for the parent body of the H chondrites are the radius, R, of the body, its formation time, tform, and the surface temperature Tsrf. They are not known in advance and have to be determined by comparison with the thermochronological data for the nine chondrites of type H4 to H6 described in Henke et al. (2013). The unknown burial depth of the meteorites within their parent body are additional unknown parameters. Hence we have a total of p = 9 + 3 free parameters that have to be determined.
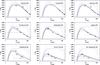 |
Fig. 4 Comparison of the thermal evolution for H chondrites of different petrologic types sampling different burial depths, using the models for hot isostatic pressing of Helle et al. (1985; black lines) or of Rao & Chaklader (1972; red lines without temperature restriction, and blue lines with). For comparison the model from Henke et al. (2013) is also shown (green lines). The symbols denote the experimentally determined closure times and closure temperatures (and their errors) for different decay systems. The full lines correspond to the thermal evolution at the burial depths of the meteorites. The dotted lines show the temperature evolution at the centre of the parent body for comparison. The dashed horizontal line corresponds to the surface/initial temperature. |
8.2. Thermochronological data
The set of meteorites and their data used for comparison with model calculations are shown in Table 5. Very similar tables have already been presented in Henke et al. (2012b) and Henke et al. (2013), but by recent improvements almost all data have slightly changed since then and, therefore, we present the complete table with the actual data. The data for the different thermochronological systems are derived as follows:
182Hf-182W system:
Hf-W ages are from Kleine et al. (2008) and were re-calculated relative to the 182Hf/180Hf of the angrite D’Orbigny, which has a Pb-Pb age of t = 4563.4 ± 0.3 Ma (Kleine et al. 2012). The closure temperature is calculated using lattice strain models.
Pb-Pb pyroxene systems:
the closure temperature for Pb diffusion in chondrule pyroxenes is estimated by Amelin et al. (2005). The age data are from Blinova et al. (2007) for Estacado and Mt. Browne, Amelin et al. (2005) for Richardton, and Bouvier et al. (2007) for Nadiabondi & Kernouvé. We note that Pb-Pb age values were slightly revised upwards (by 1 Ma) according to recent revisions of the uranium isotopic ratio (Brennecka et al. 2010).
26Al-26Mg feldspar ages:
the data are from Zinner & Göpel (2002). The closure temperature is calculated according to Dodson (1973) at 1000 K/Ma cooling rate and 2 μm feldspar grain size. The activation energy and frequency factor used for the calculation are from LaTourette & Wasserburg (1998): E = 274 kJ/mole, D0 = 1.2 × 10⁻⁶. Al-Mg ages (when compared to Henke et al. 2013) were corrected for the same shift as the U-Pb-Pb age of CAIs (see below), as this age is thought to represent the canonical ratio of aluminium isotopes.
U-Pb-Pb phosphate ages:
the closure temperature is given by Cherniak et al. (1991). Phosphate U-Pb-Pb age data are from Göpel et al. (1994), and from Blinova et al. (2007) for Estacado and Mt. Browne.
40Ar-39Ar feldspar ages:
Ar-Ar ages are from Trieloff et al. (2003) and Schwarz et al. (2006) for Mt. Browne and Guareña. Data were recalculated for the miscalibration of K decay constant (see Renne et al. 2011; Schwarz et al. 2011, 2012). The closure temperature is by Trieloff et al. (2003) and Pellas et al. (1997).
244Pu-fission tracks:
the age at 390 K is calculated from the time interval between Pu-fission track retention in merrillite at 390 K and Pu-fission track retention by pyroxene at 550 K (which corresponds to Ar-Ar feldspar age at 550 K). The data are from Trieloff et al. (2003), the closure temperature is given by Pellas et al. (1997).
For calculating the differences between the formation time of CAIs and the ages from Table 6 we take as the time of CAI formation the average of the value of 4567.2 ± 0.5 Ma before the present given by Amelin et al. (2010), and 4 567.3 ± 0.16 Ma given by Connelly et al. (2012). Closure ages for short-lived radioactives given in Table 6 refer to this reference age.
8.3. Parameter estimation
The free parameters are determined by the optimisation procedure described in Henke et al. (2012b) by comparing the run of temperature at the burial depths of the meteorites with their thermal history as described by the closure times and closure temperatures of radioactive decay systems and other clocks (see Gail et al. 2014, for a review). The parameters are varied by an optimisation algorithm and for each parameter set a complete thermal evolution model is calculated and the burial depths of the meteorites are determined that fit best to the thermochronological data of the individual meteorites.
The quality of a specific model is determined by the χ2-method. The optimisation algorithm seeks the set of model parameters for which χ2 is minimal. For this model it is assumed that it represents the properties of the parent body of the H chondrites.
We have all together N = 37 data (see Table 5). A model fit is considered to be good if χ2/ (N − p) ≲ 1. Thus, for a model with 37 data points and 3 + 9 parameters χ2/ (N − p) should be at most of order ≈1 for an acceptable model and ideally much less than this. If χ2/ (N − p) exceeds this value, it indicates that either the experimental errors are larger than the error estimates or the model that is used to fit the data is unsuited or incomplete.
8.4. Model results
In the following we compare a model for the parent body of the H chondrites using the method of Helle et al. (1985) to calculate sintering of a binary matrix-chondrule mixture with a model which uses the method of Rao & Chaklader (1972), and a model for a one-component chondritic material as it was considered in our previous attempts (Henke et al. 2012b, 2013) to reconstruct the parent body of H chondrites. The optimisation of parameters using an evolution algorithm is run for 500 generations with 20 individuals per generation.
Table 6 shows the resulting parameters for the models that result in the lowest value of χ2 and the corresponding burial depths and maximum temperatures at this depth of the nine meteorites. Figure 4 shows for all the meteorites the variation with time of the temperature at their burial depths for the different models and compares them with the empirical thermochronological data. In detail:
Model H:
this model assumes a binary matrix-chondrule mixture, dominated by the chondrules. The volume fraction fma is set to the value from Table 3 for H chondrites. Compaction is calculated using the theory of Helle et al. (1985), rheological constants are from Table 1.
The optimum model has a value of χ2/ (N − p) = 0.79 (see Table 6), which shows that it is possible to find an acceptable model fit to the empirical data, though not an excellent fit. As can be seen from Fig. 4, the model matches most of the data points quite well, except for the high temperature data of Estacado which are missed by a small margin. The data points of Nadiabondi are not well fitted; they seem to be inconsistent for some reason.
The maximum central temperature of Tc = 1274 K of this model only slightly exceeds the solidus temperature of the Fe, Ni-FeS eutectic of 1261 K (see the discussion in Henke et al. 2015, for details). Hence, in this model there could be at most a low fraction of FeS melt in the core region of the body and no differentiation whatsoever.
Model R:
this model is based on the same assumptions as the preceding model, except that the compaction is calculated according to the theory of Rao & Chaklader (1972).
The best model has a value of χ2/ (N − p) = 1.32 (see Table 6). This shows that it is possible to find a model fit to the empirical data, but a fit that is close to the limits for being acceptable. As can be seen from Fig. 4, the model matches most of the data points quite well, except for the high temperature data of Estacado and Kernouvé which are missed (and, again, the data points of Nadiabondi are not well fitted). Except for these high temperature points the model fit appears to be not worse than the preceding model. However, the maximum temperatures of H6 chondrites of >1400 K of this model are not acceptable. They are far above petrological estimates for type 6 chondrites (Dodd 1981). Thus, this model has to be rejected despite its good match for the low temperature data points.
Model Rp:
because in the foregoing model the maximum temperature at the burial depths of the H6 chondrites is unrealistic high, an optimisation was performed where the model was subjected to the restriction that the maximum temperature for H6 chondrites remains below the maximum metamorphic temperature of 1220 K derived from two-pyroxen thermometry (see Table 3). This is achieved by introducing a penalty function in the calculation of χ2 in order to discourage the optimisation algorithm to consider models where the maximum temperature at the burial depths of the H chondrites exceeds the maximum allowed temperature. The construction of the penalty function is described in Henke et al. (2015).
The resulting minimum value of χ2/ (N − p) = 2.41 (see Table 6) shows that it is not possible to find an acceptable model fit to the empirical data. The sinter theory of Rao & Chaklader (1972) does not result in an acceptable model for a chondrite parent body formed from a matrix-chondrule mixture as is observed in H chondrites.
Model O:
for comparison, Table 6 shows an optimised model for the H chondrite parent body based on the same assumptions as in Henke et al. (2013; model 1 from Table 4). This model assumes a homogeneous dust material as the chondrite precursor material and does not take care of the chondrules. Compaction is calculated using the theory of Rao & Chaklader (1972) and the rheological constants are as described in Henke et al. (2012a), which are essentially identical to that given in the first line of Table 2.
In that calculation also the value of the bulk heat conductivity at room temperature, Kb, and the initial porosity, φsrf were also included in the optimisation process such that the number of parameters for the optimisation were p = 9 + 5. The corresponding parameter values given in Table 6 are the best-fit values. The choice of the value of bulk conductivity at room temperature in the other models shown in Table 6 is motivated by this result and by the fact that the average of Kb obtained by extrapolating the experimental data for H chondrites of Yomogida & Matsui (1983) to zero porosity results in a value of Kb = 4.3 W m-1 K-1.
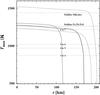 |
Fig. 5 Variation of maximum temperature in a mass element at radial position r. The radius r is the final position of the mass element after compaction of the body. Solid line: model H (see Table 6) with binary chondrule mixture and sintering calculated by theory of Helle et al. (1985). Dotted line: model R (see Table 6) with binary chondrule mixture and sintering calculated by theory of Rao & Chaklader (1972). Long dashed line: model Rp (see Table 6) with restriction for maximum temperature. Short dashed line: model O (see Table 6) with one-component dust material and sintering calculated by the theory of Rao & Chaklader (1972). The horizontal dashed lines indicate the transition temperatures between different petrologic types according to McSween et al. (1988) and the solidus temperatures of the Fe, Ni-FeS complex and the chondritic silicate-mixture. |
The optimum value of χ2/ (N − p) = 0.88 (see Table 6) shows that it is possible to find with this kind of model an acceptable model fit to the empirical data. Inspection of Fig. 4 shows that this model does not seem to be worse than model H, though it does not account for the chondrules. The tendency of models using the sinter theory of Rao & Chaklader (1972) to result in higher temperatures is probably compensated by the fact that models assuming a dust dominated material result in lower temperatures because compaction commences at lower temperature and the enhancement of heat conductivity by eliminating the pore space reduces the further temperature increase.
8.5. Temperature and surface porosity
Figure 5 shows the maximum temperature achieved during the whole thermal evolution of the body, Tmax(r), in a fixed mass element located finally (after compaction) at distance r from the centre. This figure is analogous to Figs. 3a−c where the results of some sample model calculations were shown and its meaning has already been explained in Sect. 7.3.1.
The figure shows that for our model H the highest temperature in all mass elements remains below the eutectic temperature of the Fe, Ni-FeS system for most part of the body, except for about the inner 30% of the radius, where the temperature only marginally exceeds the formation temperature of an FeS melt. The solidus temperature of the silicate component of the chondritic material (T = 1420 K, see Agee et al. 1995) is largely missed. Model H corresponds to a body that is completely undifferentiated and, thus, is compatible with observed properties of H chondrites.
As already mentioned, the central temperature in model R strongly exceeds the solidus of the silicate material in chondrites and Fig. 5 shows that this holds for most of the body. Model R, thus, is incompatible with observed properties of H chondrites because no achondrites are known that can be related to the same parent body as the H chondrites.
The distribution of maximum temperatures in our model O is similar to that in model H, as Fig. 5 shows. As already argued above, the ability of this model to reproduce the meteoritic record seems to result from a fortuitous cancellation effect.
In all models there remains a residual non-compacted outer layer where temperatures and pressures were insufficiently high to enable sintering. Table 6 gives the thickness of this layer for our models, defined as the boundary of the layer where φ> 0.1. The low heat conductivity in this layer is responsible for the rapid drop of T(r) over the last few kilometres just below the surface, which is also reflected by the Tmax(r) curves in Fig. 5. The layer is rather narrow with a thickness of 1–2 km. This poses a problem because some residual impacting by small planetesimals after cessation of the main growth phase of the parent body probably results in regolith formation and surface gardening (e.g. Warren 2011). The structure of the surface layer is presently treated in this and all other published models in an oversimplified way and requires more detailed modelling in the future.
8.6. Additional remarks
We constructed here a new model for the parent body of the H chondrites that is based on a more realistic treatment of the compaction process of the chondritic material and considers that the chondritic material is a mixture of matrix material and chondrules. The model calculation shows that it is possible to find model parameters that reproduce precise experimental cooling data of a set of H chondrites for which a complete record of their cooling history is available.
The present model is based on more realistic assumptions with respect to the basic physics to be considered than previous models. It still uses, however, approximations that are not completely realistic, for example an approximation of unclear accuracy for the heat conductivity of a porous multi-component mixed material, a simplified treatment of the surface layer, just to mention two of the major remaining modelling problems.
Besides the data on the nine meteorites from Table 5 having at least three measurements on closure times and closure temperatures there are additional meteorites with a lower number of such data (see e.g. Harrison & Grimm 2010). The inclusion of such data material in our model will be discussed in another paper. For a not-so-small number of meteorites there are also experimentally determined cooling rates determined by other methods (see Scott et al. 2014, and references therein). Discussions of such metallographic cooling rates come to a completely different picture on the thermal evolution of the H chondrite parent body than that outlined in this paper and reject the onion shell hypothesis on which the present model is based. The origin of this discrepancy is presently unclear, but we emphasise that on the basis of the onion-shell model it is possible to arrive at a completely consistent model for the H chondrite parent body in accordance with the thermal history derived from radioactive decay systems, based only on the basic physics of the problem without introducing any adhoc hypotheses of any kind.
9. Concluding remarks
This paper develops an approach to modelling the sintering of the chondritic precursor material from which planetesimals are formed in the terrestrial planet formation zone of the solar system. The compaction behaviour of the granular initial material is crucial for the thermal conductivity of the material and determines the temperature evolution in planetesimals due to radioactive heating and subsequent cooling after exhaustion of the efficient heat sources. The most precise knowledge possible of the thermal history of planetesimals is crucial for interpreting thermochronological data of meteorites and the reconstruction of important processes at the formation time of planets.
The following topics are treated in this paper:
-
The calculation of the hot isostatic compression of granular material. The use of a model approach (Helle et al. 1985) that has been developed for modelling technical manufacturing processes is proposed.
-
A brief comparison between computed sintering of olivine powder with published data of laboratory compaction experiments. This shows satisfactory agreement between model and experimental results. The result suggests that the sinter theory of Helle et al. (1985) can be applied with sufficient accuracy to the compaction of meteoritic precursor material.
-
A qualitative discussion of the different compaction behaviour of fine-grained matrix material and coarse-grained chondrule material. We found that the two components of chondrite material, matrix and chondrules, behave quite differently and compaction occurs at temperatures that are roughly 200 K higher for chondrules than for matrix.
-
An approach for treating the compaction of the binary mixture of matrix and chondrules, which is observed in (almost) all meteoritic classes, if the compaction of planetesimals during the course of their thermal evolution is to be calculated.
-
Construction of a new model for the parent body of the H chondrites by comparing models of its thermal evolution with thermochronologic data of nine meteorites with well-defined empirical cooling curves and a parameter estimation based on an optimisation algorithm. The optimisation results in a satisfactory fit of all thermochronological data used.
Online material
Appendix A: Binary granular mixtures
The strong dichotomy between sizes of chondrules and matrix particles suggests the treatment of the chondritic granular mixture as a binary mixture of two granular components with significantly different sizes. The two components each are idealized as mono-sized. This case has been studied in powder technology and some general results are available (see e.g. Fiske et al. 1994,and references therein). Here we give a simplified treatment appropriate for chondritic material.
We denote the diameters of the small and large components (matrix and chondrules) as
dma and dch,
respectively, and define the size parameter
 (A.1)For all known meteoritic classes this size
parameter is well above the value of α ≳ 7 above which the small particles easily fit
into the interstitials between the large particles. In fact, the value of
α is at
least 102 and
probably above 103 at the early stages of planetesimal evolution before
Ostwald ripening of the matrix particulates. Then also “wall effects” are completely
negligible where the packing of matrix particles immediately adjacent to a large
particle is somewhat less dense than where small particles are only surrounded by small
particles. This allows us to treat the chondritic granular mixture as one of two
different cases:
(A.1)For all known meteoritic classes this size
parameter is well above the value of α ≳ 7 above which the small particles easily fit
into the interstitials between the large particles. In fact, the value of
α is at
least 102 and
probably above 103 at the early stages of planetesimal evolution before
Ostwald ripening of the matrix particulates. Then also “wall effects” are completely
negligible where the packing of matrix particles immediately adjacent to a large
particle is somewhat less dense than where small particles are only surrounded by small
particles. This allows us to treat the chondritic granular mixture as one of two
different cases:
-
Chondrule-dominated material. The chondrules form a closest packing and the matrix material partially or completely fills the pore space between the closely packed chondrules.
-
Matrix-dominated material. The matrix forms a close packing and rare chondrules are interspersed into the matrix material.
First consider the chondrule-dominated material. A volume V may be filled with
chondrules. The fraction of V filled by chondrules is denoted as
 (A.2)where Vch is the
total volume of all chondrules in V. We assume that the chondrules form a closest
packing such that the chondrules are immobile in this packing. We denote the
corresponding value of D as Dcp, which would typically be equal to
≈0.64 for a random closest
packing of spheres. The volume of interstitials (pores) between the chondrules is
(A.2)where Vch is the
total volume of all chondrules in V. We assume that the chondrules form a closest
packing such that the chondrules are immobile in this packing. We denote the
corresponding value of D as Dcp, which would typically be equal to
≈0.64 for a random closest
packing of spheres. The volume of interstitials (pores) between the chondrules is
 (A.3)where φ = 1 −
D is the porosity.
(A.3)where φ = 1 −
D is the porosity.
Now we assume that we have given volumes Vch and Vma of
chondrule and matrix material, where the matrix material at most fills the voids between
the chondrules. These volumes refer to the true volume filled by the corresponding
materials and does not include the voids between the particles. The total volume filled
by the granular material is determined by the volume of the chondrules and the void
space between them (which, however, is not empty in our case but is partially filled
with matrix). This volume is  (A.4)The volume filled by matrix and chondrule
material is Vma +
Vch such that the packing fraction of
the mixture is
(A.4)The volume filled by matrix and chondrule
material is Vma +
Vch such that the packing fraction of
the mixture is  (A.5)We define by
  (A.6)the volume fraction of matrix to total
material. With this we can write
(A.6)the volume fraction of matrix to total
material. With this we can write  (A.7)This is the effective filling factor of the
chondrule-matrix mixture in the chondrule-dominated case.
(A.7)This is the effective filling factor of the
chondrule-matrix mixture in the chondrule-dominated case.
Next we consider the matrix-dominated case. The volume filled by the matrix inclusive
the void space between matrix particles is Vma/Dcp
where it is assumed that the filling factor Dcp of the porous matrix material is
the same as just before. The total volume filled by matrix and chondrules is
 (A.8)The filling factor of the matrix-chondrule
mixture is
(A.8)The filling factor of the matrix-chondrule
mixture is  (A.9)and with definition (A.6) of the matrix volume fraction we
obtain
(A.9)and with definition (A.6) of the matrix volume fraction we
obtain (A.10)This is the effective filling factor of the
chondrule-matrix mixture in the matrix-dominated case.
(A.10)This is the effective filling factor of the
chondrule-matrix mixture in the matrix-dominated case.
At the limit between the two cases the results for the filling factors corresponding to
the two cases have to equal each other. From this one finds a matrix volume fraction at
the transition of  (A.11)The filling factor takes at the transition
its maximum which equals
(A.11)The filling factor takes at the transition
its maximum which equals  (A.12)In terms of the porosity (which is minimum
if D is
maximum) this takes the obvious form
(A.12)In terms of the porosity (which is minimum
if D is
maximum) this takes the obvious form
 (A.13)If it is assumed that the chondrules are
equal sized spheres, the filling factor for the random closest packing is
Dcp ≈
0.64 (e.g. Onoda & Liniger
1990; Jaeger & Nagel 1992). The
random loosest packing of spheres where the particles just resist to small external
forces has a filling factor of Dcp ≈ 0.56 (e.g. Onoda & Liniger 1990; Jaeger
& Nagel 1992; Güttler et al. 2009).
Figure A.1 shows the variation of the effective
porosity of the chondrule-matrix mixture with matrix fraction for these two cases and
Table A.1 gives some numerical values. In
principle the initial structure of the chondritic material could be somewhere in between
these two cases. Because during the growth of planetesimals by collisions with other
planetesimals the surface material is permanently gardened, we assume that the filling
factor corresponds to the closest random packing as in experiments this kind of packing
is the outcome after vigorous stirring and shaking of a granular material.
(A.13)If it is assumed that the chondrules are
equal sized spheres, the filling factor for the random closest packing is
Dcp ≈
0.64 (e.g. Onoda & Liniger
1990; Jaeger & Nagel 1992). The
random loosest packing of spheres where the particles just resist to small external
forces has a filling factor of Dcp ≈ 0.56 (e.g. Onoda & Liniger 1990; Jaeger
& Nagel 1992; Güttler et al. 2009).
Figure A.1 shows the variation of the effective
porosity of the chondrule-matrix mixture with matrix fraction for these two cases and
Table A.1 gives some numerical values. In
principle the initial structure of the chondritic material could be somewhere in between
these two cases. Because during the growth of planetesimals by collisions with other
planetesimals the surface material is permanently gardened, we assume that the filling
factor corresponds to the closest random packing as in experiments this kind of packing
is the outcome after vigorous stirring and shaking of a granular material.
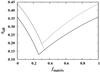 |
Fig. A.1 Variation of effective porosity of a binary granular mixture of matrix and chondrules with volume fraction (with respect to matter-filled volume) of matrix. Full line: the case of random closest packing of spheres, corresponding to Dcp = 0.64. Dashed line: the case of loosest close packing of spheres, corresponding to Dcp = 0.56. Dotted line: the case of random closest packing of the matrix material where the interspersed chondrules are more densely packed than in the loose close packing. |
Some characteristic numbers for a chondrule-matrix mixture.
The experimental results shown in Fiske et al. (1994) confirm that the equations for the effective packing fraction given above are good approximations for the properties of real binary granular media.
In the case of matrix-dominated material one has also to observe the filling factor of
the chondrules interspersed in the matrix ground mass. This filling factor is defined as
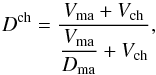 (A.14)where Dma is the
filling factor of the matrix ground mass. Eliminating Vma by means
of Eq. (A.6) results in
(A.14)where Dma is the
filling factor of the matrix ground mass. Eliminating Vma by means
of Eq. (A.6) results in 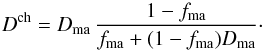 (A.15)This filling factor equals the loose random
closest packing Dl ≈ 0.56 where the packing of
chondrules becomes immobile for a value of the volume fraction of matrix material
(A.15)This filling factor equals the loose random
closest packing Dl ≈ 0.56 where the packing of
chondrules becomes immobile for a value of the volume fraction of matrix material
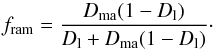 (A.16)In the incompacted state the filling factor
of the porous matrix component should equal the closest random packing Dcp ≈ 0.64.
The value of fram for this case is shown in Table
A.1. For lower filling factors the effective
filling factor of the matrix-chondrule mixture is
(A.16)In the incompacted state the filling factor
of the porous matrix component should equal the closest random packing Dcp ≈ 0.64.
The value of fram for this case is shown in Table
A.1. For lower filling factors the effective
filling factor of the matrix-chondrule mixture is
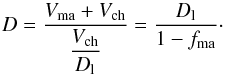 (A.17)This is also shown in Fig. A.1. For f below the limit value of ftran
corresponding to Dcp = Dl
the packing fraction coincides with the packing fraction of the loose close packing.
This type of packing in principle is unstable because the porous matrix does not
completely fill the voids between the chondrules. By shaking it would make a transition
to the case of random closest packing of both the chondrules and the matrix.
(A.17)This is also shown in Fig. A.1. For f below the limit value of ftran
corresponding to Dcp = Dl
the packing fraction coincides with the packing fraction of the loose close packing.
This type of packing in principle is unstable because the porous matrix does not
completely fill the voids between the chondrules. By shaking it would make a transition
to the case of random closest packing of both the chondrules and the matrix.
Appendix B: Hot isostatic pressing of a binary granular mixture
For hot isostatic pressing of the chondritic binary mixture one has to observe that sintering of the pure matrix material because of the smallness of the particles occurs at lower temperature by surface diffusion than sintering of the pure chondrule material by dislocation creep. This has to be observed in the modelling of the sintering process.
First we consider the case of a chondrule-dominated material. Since the matrix does not completely fill the voids between the chondrules if the matrix fraction is less than the value given by Eq. (A.11), the pressure loading rests on the contacts between the chondrules. The matrix is essentially only subject to the low gas pressure and sintering of the matrix is mainly driven by surface tension. Though the filling factor of the initially porous matrix material increases up to unity during sintering of the matrix material, the effective filling factor of the matrix-chondrule mixture given by Eq. (A.7) does not change. The only thing one has to do is to use this effective packing fraction and not Dcp as the initial value if we solve the differential equation for the time evolution of the filling factor of the chondrules.
In the case of matrix-dominated material we have to discriminate between two different
cases that are related to the filling factor of the chondrules interspersed in the
matrix ground mass. During sintering of the matrix the filling factor Dma increases
from the initial value Dcp for the closest packing of the
non-sintered material to a maximum value of unity. At the same time Dch, given by
Eq. (A.15), also increases. This filling
factor then could approach the value corresponding to the loose random closest packing
Dl ≈
0.56 where the packing of chondrules becomes immobile. If we assume
that the chondrule material is more rigid than the matrix material, the sintering of
matrix material beyond this point cannot increase the effective packing fraction of the
matrix-chondrule mixture. The further sintering of the matrix occurs under zero pressure
conditions because the still porous matrix material then incompletely fills the space
between the chondrules and therefore partially detaches from them. The condition that
Dch<Dl
at complete sintering of the matrix (Dma = 1) is
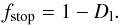 (B.1)The value of this limit is higher than the
limit fram, defined by Eq. (A.16), where the filling factor of the
chondrules already equals Dl before compaction starts.
(B.1)The value of this limit is higher than the
limit fram, defined by Eq. (A.16), where the filling factor of the
chondrules already equals Dl before compaction starts.
If fma>fstop,
reducing of the distance between chondrules during sintering of the matrix ground mass
does not increase the packing fraction of the chondrules to the limit Dl. Sintering
has to be calculated in this case by solving the differential equation for the time
evolution of the filling factor of the matrix, Dma, with the
initial value Dcp. The pressure loading rests on the
contacts between the matrix particles. The effective porosity for the matrix-chondrule
mixture follows from the analogue of Eq. (A.10) 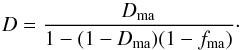 (B.2)In the case ftrans ≤
fma ≤ fstop
one also has to solve the differential equation for the time evolution of the
filling factor of the matrix, Dma, with the
initial value Dcp. The effective porosity for the
matrix-chondrule mixture is given by Eq. (B.2) as long as Dch calculated from Eq. (A.15) remains less than Dl. The
effective filling factor of the mixture at this point follows from Eq. (A.15) by letting Dch =
Dl; its value is
(B.2)In the case ftrans ≤
fma ≤ fstop
one also has to solve the differential equation for the time evolution of the
filling factor of the matrix, Dma, with the
initial value Dcp. The effective porosity for the
matrix-chondrule mixture is given by Eq. (B.2) as long as Dch calculated from Eq. (A.15) remains less than Dl. The
effective filling factor of the mixture at this point follows from Eq. (A.15) by letting Dch =
Dl; its value is
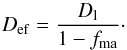 (B.3)If Dma exceeds
this value the pressure load is taken over by the chondrules and the calculation of the
matrix filling factor has to be continued with zero pressure load for the matrix
(B.3)If Dma exceeds
this value the pressure load is taken over by the chondrules and the calculation of the
matrix filling factor has to be continued with zero pressure load for the matrix
until Dma = 1. The effective filling factor of the matrix-chondrule mixture is Def and remains constant until Dma = 1. From this point on the differential equation for the time evolution of the filling factor of the chondrules has to be solved with the initial value Def.
We can thus discriminate between three different sintering modes of the binary granular mixture of chondritic material, depending on the relative abundance, fma, of matrix material:
-
1.
The chondrule-dominated case fma<ftrans where the shrinking of the material is determined by sintering of the chondrule component.
-
2.
The matrix-dominated case fstop<fma where the shrinking of the material is determined by sintering of the matrix component.
-
3.
The two-step case fma ≤ ftrans ≤ fstop where the shrinking of the material occurs in two steps, first by sintering of the matrix component and then by sintering of the chondrule component.
Also accessible via: http://engineering.dartmouth.edu/defmech/
This is valid only if we consider formation times later than ≈1.5 Myr where the remaining latent heat of radioactives suffices to heat the body to just somewhat above 1000 K and bodies that are sufficiently large that the liberated heat is not immediately lost by transport to the surface (size ≳50 km). These assumptions are generally assumed to hold for the parent bodies of chondrites.
Acknowledgments
This work was supported by special research program 1385, supported by the “Deutsche Forschungsgemeinschaft (DFG)”.
References
- Agee, C. B., Li, J., Shannon, M. C., & Circone, S. 1995, J. Geophys. Res., 100, 17725 [NASA ADS] [CrossRef] [Google Scholar]
- Akridge, G., Benoit, P. H., & Sears, D. W. G. 1997, Lunar Plan. Sc. Conf., XXVIII, 1178 [Google Scholar]
- Amelin, Y., Ghosh, A., & Rotenberg, E. 2005, Geochim. Cosmochim. Acta, 69, 505 [NASA ADS] [CrossRef] [Google Scholar]
- Amelin, Y., Kaltenbach, A., Iizuka, T., et al. 2010, Earth Planet. Sci. Lett., 300, 343 [NASA ADS] [CrossRef] [Google Scholar]
- Arzt, E., Ashby, M. F., & Easterling, K. E. 1983, Metall. Transact. A, 14A, 211 [Google Scholar]
- Atkinson, H. V., & Davis, S. 2000, Metall. Mater. Trans., 31A, 2981 [Google Scholar]
- Blinova, A., Amelin, Y., & Samson, C. 2007, Meteor. Planet Sci., 42, 1337 [NASA ADS] [CrossRef] [Google Scholar]
- Bottke, W., Vokrouhlicky, D., Nesvorny, D., & Shrbeny, L. 2010, in AAS/Division for Planetary Sciences Meeting Abstracts #42, BAAS, 42, 1051 [Google Scholar]
- Bouvier, A., Blichert-Toft, J., Moynier, F., Vervoort, J., & Albarède, F. 2007, Geochim. Cosmochim. Acta, 71, 1583 [NASA ADS] [CrossRef] [Google Scholar]
- Brearley, A. J., & Jones, R. H. 1998, in Reviews in Mineralogy Planetary Materials, ed. J. J. Papike (Washington DC: Mineralogical Society of America), 36 [Google Scholar]
- Brennecka, G. A., Weyer, S., Wadhwa, M., et al. 2010, Science, 327, 449 [NASA ADS] [CrossRef] [Google Scholar]
- Bystricky, M., & Mackwell, S. 2001, J. Geophys. Res., 106, 13443 [NASA ADS] [CrossRef] [Google Scholar]
- Cherniak, D., Lanford, W. A., & Ryerson, F. J. 1991, Geochim. Cosmochim. Acta, 55, 1663 [NASA ADS] [CrossRef] [Google Scholar]
- Clayton, R. N., Onuma, N., & Mayeda, T. K. 1976, Earth Planet Sci Lett., 30, 10 [NASA ADS] [CrossRef] [Google Scholar]
- Connelly, J. N., Bizzarro, M., Krot, A. N., et al. 2012, Science, 338, 651 [NASA ADS] [CrossRef] [Google Scholar]
- Consolmagno, G., Britt, D., & Macke, R. 2008, Chemie der Erde/Geochemistry, 68, 1 [Google Scholar]
- Dodd, R. T. 1981, Meteorites: A Petrologic-Chemical Synthesis (Cambridge: Cambridge University Press) [Google Scholar]
- Dodson, M. H. 1973, Contributions to Mineralogy and Petrology, 40, 259 [Google Scholar]
- Eluszkiewicz, J. 1990, Icarus, 84, 215 [NASA ADS] [CrossRef] [Google Scholar]
- Evans, J. B. 1978, Ph.D. Thesis, Massachusetts Institute of Technology [Google Scholar]
- Fiske, T. J., Railkar, S. B., & Kalyon, D. M. 1994, Powder Technology, 81, 57 [Google Scholar]
- Frost, H. J., & Ashby, M. F. 1982, Deformation-mechanism Maps (Oxford: Pergamon Press) [Google Scholar]
- Gaffey, M. J., & Gilbert, S. L. 1998, Meteor. Planet. Sci., 33, 1281 [NASA ADS] [CrossRef] [Google Scholar]
- Gail, H.-P., Trieloff, M., Breuer, D., & Spohn, T. 2014, in Protostars and Planets VI, eds. H. Beuther, R. Klessen, C. Dullemond, & T. Henning (Tucson: University of Arizona Press), 571 [Google Scholar]
- Göpel, C., Manhes, G., & Allegre, C. J. 1994, Earth Planet Sci. Lett., 121, 153 [Google Scholar]
- Güttler, C., Krause, M., Geretshauser, R. J., Speith, R., & Blum, J. 2009, ApJ, 701, 130 [NASA ADS] [CrossRef] [Google Scholar]
- Harrison, K. P., & Grimm, R. E. 2010, Geochim. Cosmochim. Acta, 74, 5410 [NASA ADS] [CrossRef] [Google Scholar]
- Helle, A. S., Easterling, K. E., & Ashby, M. F. 1985, Acta Metall., 33, 2163 [CrossRef] [Google Scholar]
- Henke, S., Gail, H.-P., Trieloff, M., Schwarz, W. H., & Kleine, T. 2012a, A&A, 537, A45 [NASA ADS] [CrossRef] [EDP Sciences] [Google Scholar]
- Henke, S., Gail, H.-P., Trieloff, M., Schwarz, W. H., & Kleine, T. 2012b, A&A, 545, A135 [NASA ADS] [CrossRef] [EDP Sciences] [Google Scholar]
- Henke, S., Gail, H.-P., Trieloff, M., & Schwarz, W. H. 2013, Icarus, 226, 212 [NASA ADS] [CrossRef] [Google Scholar]
- Henke, S., Gail, H.-P., Trieloff, M., & Schwarz, W. H. 2015, Meteor. Planet Sci., submitted [Google Scholar]
- Jaeger, H. M., & Nagel, S. R. 1992, Science, 255, 1523 [NASA ADS] [CrossRef] [PubMed] [Google Scholar]
- Kakar, A. K., & Chaklader, A. C. D. 1967, J. Appl. Phys., 38, 3223 [NASA ADS] [CrossRef] [Google Scholar]
- Karato, S., & Jung, H. 2003, Philos. Mag. A, 83, 401 [NASA ADS] [CrossRef] [Google Scholar]
- Kleine, T., Touboul, M., Van Orman, J., et al. 2008, Earth Planet Sci. Lett, 270, 106 [NASA ADS] [CrossRef] [Google Scholar]
- Kleine, T., Hans, U., Irving, A. J., & Bourdon, B. 2012, Geochim. Cosmochim. Acta [Google Scholar]
- Krause, M., Henke, S., Gail, H.-P., et al. 2011, Lunar Planet. Sci. Conf. Lett., 42, 2696 [NASA ADS] [Google Scholar]
- LaTourette, T., & Wasserburg, G. 1998, Earth Plan. Sci. Lett., 158, 91 [NASA ADS] [CrossRef] [Google Scholar]
- Lawlis, J. 1998, Ph.D. Thesis, The Pennsylvania State University [Google Scholar]
- McCausland, P. J. A., Brown, P. G., & Wilson, G. C. 2006, JRASC, 100, 104 [NASA ADS] [Google Scholar]
- McSween, H. Y., Sears, D. W. G., & Dodd, R. T. 1988, in Meteorites and the Early Solar System, edS. J. F. Kerridge, & M. S. Matthews (Tucson: University of Arizona Press), 102 [Google Scholar]
- Monnereau, M., Toplis, M. J., Baratoux, D., & Guignard, J. 2013, Geochim. Cosmochim. Acta, 119, 302 [NASA ADS] [CrossRef] [Google Scholar]
- Morbidelli, A., Gonczi, R., Froeschleé, C., & Farinella, P. 1994, A&A, 282, 955 [NASA ADS] [Google Scholar]
- Nagasawa, M., Thommes, E. W., Kenyon, S. J., Bromley, B. C., & Lin, D. N. C. 2007, in Protostars and Planets V, eds. B. Reipurt, D. Jewitt, & K. Keil (Tucson: University of Arizona Press), 639 [Google Scholar]
- Onoda, G. Y., & Liniger, E. G. 1990, Phys. Rev. Lett., 64, 2727 [NASA ADS] [CrossRef] [PubMed] [Google Scholar]
- Pellas, P., Fiéni, C., Trieloff, M., & Jessberger, E. 1997, Geochim. Cosmochim. Acta, 61, 3477 [NASA ADS] [CrossRef] [Google Scholar]
- Rao, A. S., & Chaklader, A. C. D. 1972, J. Am. Ceram. Soc., 55, 596 [CrossRef] [Google Scholar]
- Renne, P. R., Balco, G., Ludwig, K. R., Mundil, R., & Min, K. 2011, Geochim. Cosmochim. Acta, 75, 5097 [NASA ADS] [CrossRef] [Google Scholar]
- Schwarz, W. H., Trieloff, M., Korochantseva, E. V., & Buikin, A. I. 2006, Meteoritics & Planetary Science Supplement, Proc. 69th Annual Meet. Meteor. Soc., 41, 5132, A161 [Google Scholar]
- Schwarz, W. H., Kossert, K., Trieloff, M., & Hopp, J. 2011, Geochim. Cosmochim. Acta, 75, 5094 [NASA ADS] [CrossRef] [Google Scholar]
- Schwarz, W. H., Henke, S., Trieloff, M., & Gail, H.-P. 2012, in 34th IGC Brisbane, 3139 [Google Scholar]
- Schwenn, M. B., & Goetze, C. 1978, Tectonophysics, 48, 41 [NASA ADS] [CrossRef] [Google Scholar]
- Scott, G. D. 1962, Nature, 194, 956 [NASA ADS] [CrossRef] [Google Scholar]
- Scott, E. R. D. 2007, Ann. Rev. Earth Planet Sci., 35, 577 [NASA ADS] [CrossRef] [Google Scholar]
- Scott, E. R. D., Krot, T. V., Goldstein, J. I., & Wakita, S. 2014, Geochim. Cosmochim. Acta, 136, 13 [NASA ADS] [CrossRef] [Google Scholar]
- Sears, D. W. G., & Dodd, R. T. 1988, in Meteorites and the early solar system, eds. J. F. Kerridge, & M. S. Matthews (Tucson: University of Arizona Press), 3 [Google Scholar]
- Senshu, H. 2004, Lunar Planet Sci. Conf., XXXV, 1557 [NASA ADS] [Google Scholar]
- Trieloff, M., & Palme, H. 2006, in Planet Formation, eds. H. Klahr, & W. Brandner (Cambridge University Press), 64 [Google Scholar]
- Trieloff, M., Jessberger, E. K., Herrwerth, I., et al. 2003, Nature, 422, 502 [NASA ADS] [CrossRef] [Google Scholar]
- Warren, P. H. 2011, Meteor. Planet Sci., 46, 53 [Google Scholar]
- Weidenschilling, S. 2011, Icarus, 214, 671 [NASA ADS] [CrossRef] [Google Scholar]
- Weidenschilling, S. J., & Cuzzi, J. N. 2006, in Meteorites and the Early Solar System II, eds. D. S. Lauretta, & H. Y. McSween (Tucson: University of Arizona Press), 473 [Google Scholar]
- Xu, Y., Shankland, T. J., Linhardt, S., et al. 2004, Phys. Earth Planet. Inter., 143, 321 [NASA ADS] [CrossRef] [Google Scholar]
- Yomogida, K., & Matsui, T. 1983, J. Geophys. Res., 88, 9513 [Google Scholar]
- Yomogida, K., & Matsui, T. 1984, Earth Planet Sci. L, 68, 34 [Google Scholar]
- Zinner, E., & Göpel, C. 2002, Meteor. Planet Sci., 37, 1001 [NASA ADS] [CrossRef] [Google Scholar]
All Tables
Numerical values of the coefficients describing material properties for some materials of interest in SI units, temperatures in K.
Literature data for experimental determinations of rheological data parametrised in
the form
for dry olivines and pyroxenes.
Parameters for optimised models of the parent body of H chondrites for chondrule-dominated binary granular mixture based on the theories of sintering by Helle et al. (1985; model H) or Rao & Chaklader (1972; models R and Rp).
All Figures
|
Fig. 1 Comparison of laboratory hot pressing measurements at fixed p and T (shown at the curves) for San Carlos olivine granular material from Schwenn & Goetze (1978; dashed line) and results of a model calculation using coefficients given in Table 1 (full lines). The particle size is between 0.25 and 0.5 mm in sample S7 and between 0.5 and 1 mm in sample S15. The pressure and temperature conditions are such that sintering proceeds via power-law creep. |
| In the text | |
|
Fig. 2 Variation of compaction timescale, tcomp, with grain radius G for sintering a granular material of olivine and corundum beads from D = 0.64 to D = 0.90 at different temperatures for different pressures. Also indicated are the characteristic sizes of chondrules, matrix, and dust particles in the solar nebula. |
| In the text | |
|
Fig. 3 Variation of maximum temperature in a mass element at radial position r. The radius r is the final position of the mass element after sintering of the body has finished. a) Chondrule dominated material with olivine composition. Solid line: sinter algorithm according to Helle, rheological constants from Table 1. Dotted line: sinter algorithm according to Helle, rheological constants from Table 2. Long dashed line: sinter algorithm according to Chaklader, rheological constants as in Henke et al. (2012b). Short dashed line: sinter algorithm according to Chaklader, rheological constants from Table 2. b) Chondrule dominated material, sinter algorithm according to Helle. Solid line: enstatite composition. Dashed line: olivine composition. c) Matrix dominated material, sinter algorithm according to Helle (solid line). For comparison, the dashed line corresponds to a model with chondrule-dominated material. d) Evolution of porosity φ with central temperature Tc. Solid line: chondrule-dominated material. Dashed line: matrix-dominated material. The horizontal dashed lines in images a) to c) indicate the transition temperatures between different petrologic types according to McSween et al. (1988) and the solidus temperatures of the Fe, Ni-FeS complex and the chondritic silicate-mixture. |
| In the text | |
|
Fig. 4 Comparison of the thermal evolution for H chondrites of different petrologic types sampling different burial depths, using the models for hot isostatic pressing of Helle et al. (1985; black lines) or of Rao & Chaklader (1972; red lines without temperature restriction, and blue lines with). For comparison the model from Henke et al. (2013) is also shown (green lines). The symbols denote the experimentally determined closure times and closure temperatures (and their errors) for different decay systems. The full lines correspond to the thermal evolution at the burial depths of the meteorites. The dotted lines show the temperature evolution at the centre of the parent body for comparison. The dashed horizontal line corresponds to the surface/initial temperature. |
| In the text | |
|
Fig. 5 Variation of maximum temperature in a mass element at radial position r. The radius r is the final position of the mass element after compaction of the body. Solid line: model H (see Table 6) with binary chondrule mixture and sintering calculated by theory of Helle et al. (1985). Dotted line: model R (see Table 6) with binary chondrule mixture and sintering calculated by theory of Rao & Chaklader (1972). Long dashed line: model Rp (see Table 6) with restriction for maximum temperature. Short dashed line: model O (see Table 6) with one-component dust material and sintering calculated by the theory of Rao & Chaklader (1972). The horizontal dashed lines indicate the transition temperatures between different petrologic types according to McSween et al. (1988) and the solidus temperatures of the Fe, Ni-FeS complex and the chondritic silicate-mixture. |
| In the text | |
|
Fig. A.1 Variation of effective porosity of a binary granular mixture of matrix and chondrules with volume fraction (with respect to matter-filled volume) of matrix. Full line: the case of random closest packing of spheres, corresponding to Dcp = 0.64. Dashed line: the case of loosest close packing of spheres, corresponding to Dcp = 0.56. Dotted line: the case of random closest packing of the matrix material where the interspersed chondrules are more densely packed than in the loose close packing. |
| In the text | |
Current usage metrics show cumulative count of Article Views (full-text article views including HTML views, PDF and ePub downloads, according to the available data) and Abstracts Views on Vision4Press platform.
Data correspond to usage on the plateform after 2015. The current usage metrics is available 48-96 hours after online publication and is updated daily on week days.
Initial download of the metrics may take a while.