Fig. 4
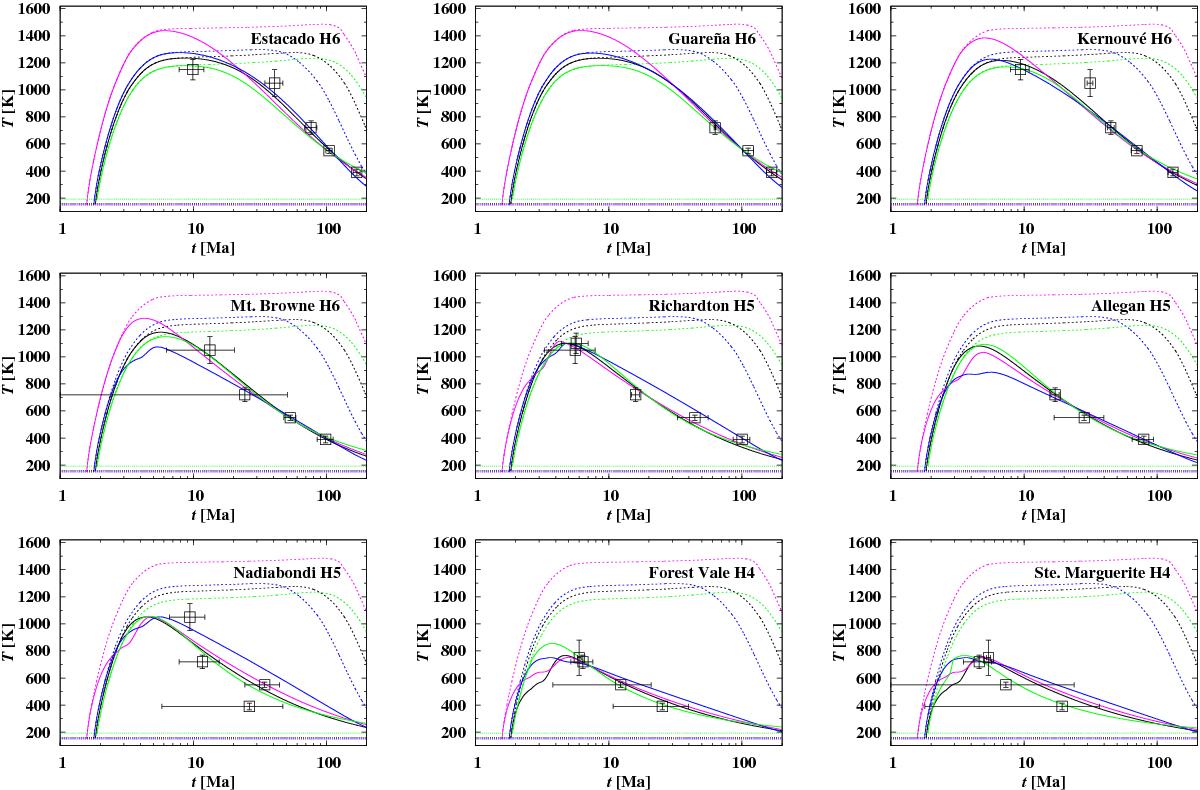
Comparison of the thermal evolution for H chondrites of different petrologic types sampling different burial depths, using the models for hot isostatic pressing of Helle et al. (1985; black lines) or of Rao & Chaklader (1972; red lines without temperature restriction, and blue lines with). For comparison the model from Henke et al. (2013) is also shown (green lines). The symbols denote the experimentally determined closure times and closure temperatures (and their errors) for different decay systems. The full lines correspond to the thermal evolution at the burial depths of the meteorites. The dotted lines show the temperature evolution at the centre of the parent body for comparison. The dashed horizontal line corresponds to the surface/initial temperature.
Current usage metrics show cumulative count of Article Views (full-text article views including HTML views, PDF and ePub downloads, according to the available data) and Abstracts Views on Vision4Press platform.
Data correspond to usage on the plateform after 2015. The current usage metrics is available 48-96 hours after online publication and is updated daily on week days.
Initial download of the metrics may take a while.