Fig. 5
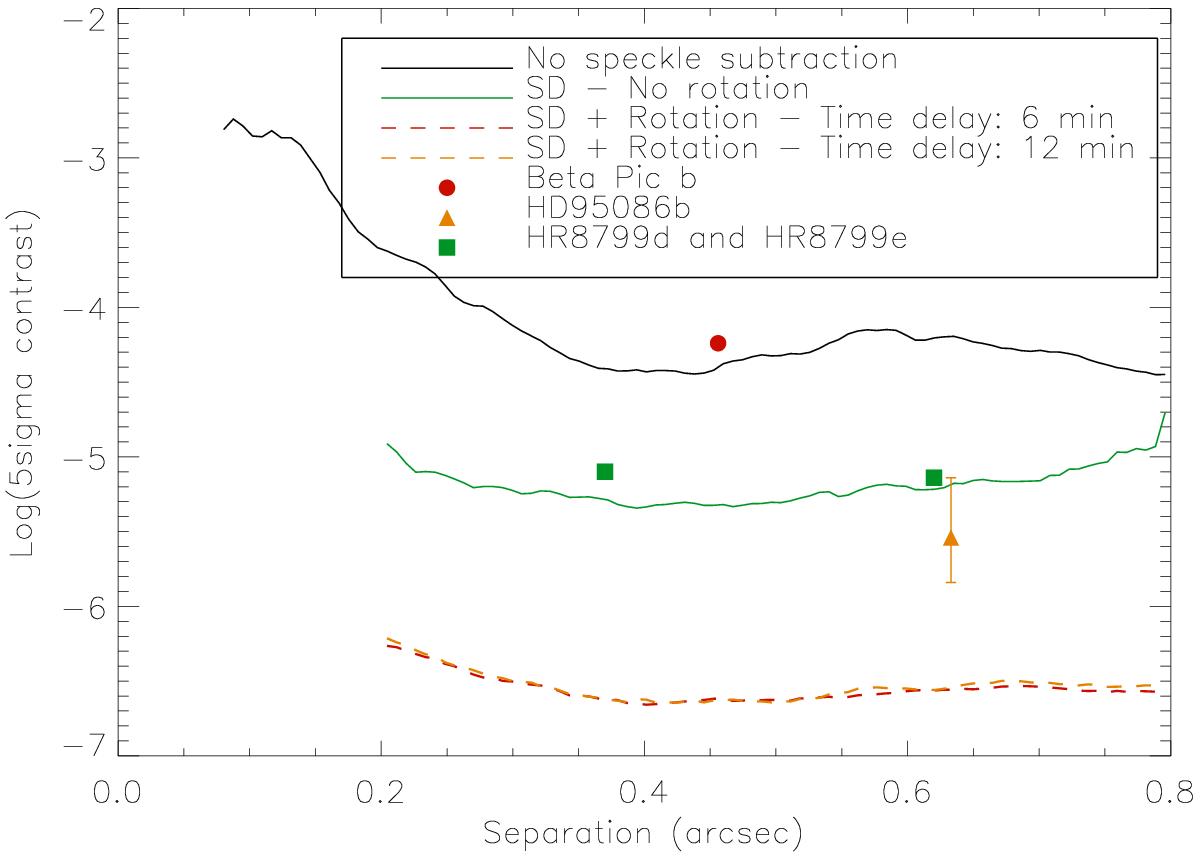
5σ contrast plot with the IFS operating in YJ-mode while simulating observations of a bright star and using the updated SD method. The contrast solid curve in black is obtained without any speckle subtraction while the green curve is obtained applying the updated SD procedure. The red and orange dashed curves show the contrast obtained with the simulated ADI procedure in addition to the speckle subtraction. Different symbols are used to indicate the positions of known planets on this plot.
Current usage metrics show cumulative count of Article Views (full-text article views including HTML views, PDF and ePub downloads, according to the available data) and Abstracts Views on Vision4Press platform.
Data correspond to usage on the plateform after 2015. The current usage metrics is available 48-96 hours after online publication and is updated daily on week days.
Initial download of the metrics may take a while.