Fig. 17
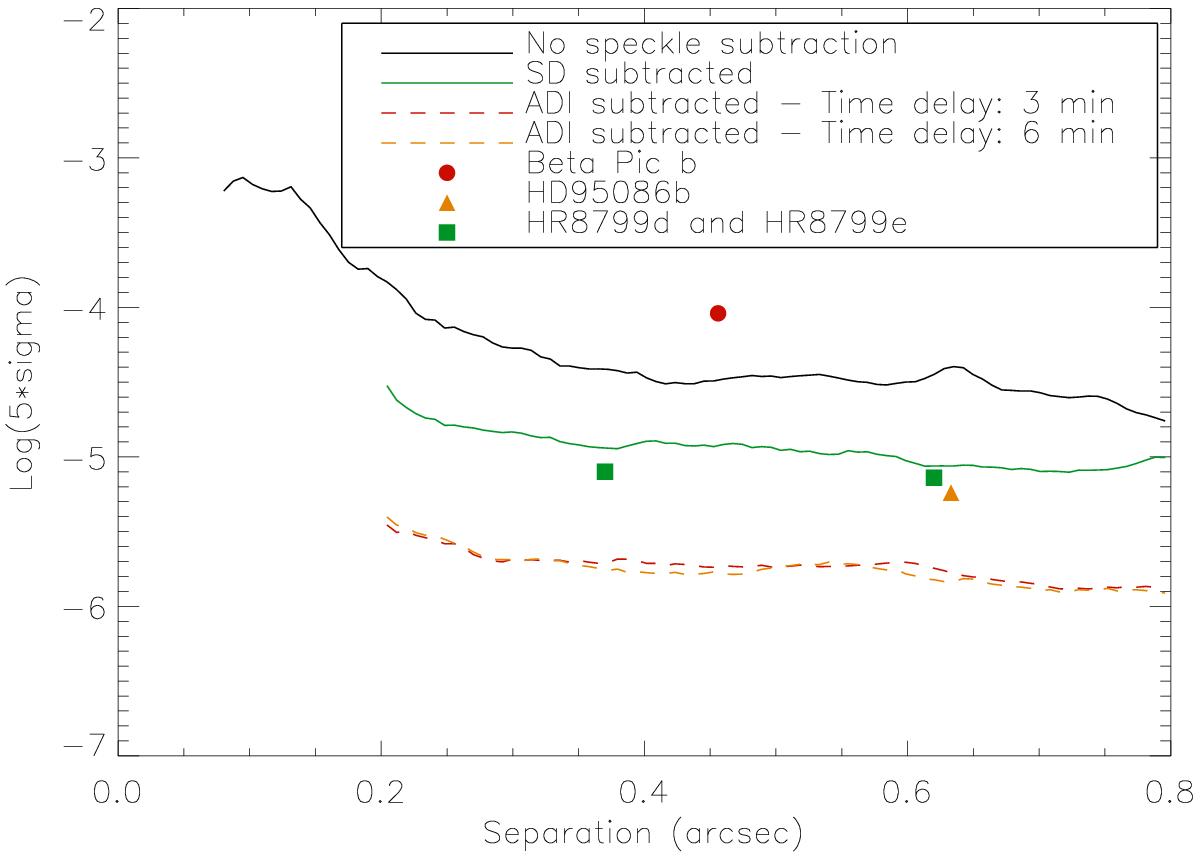
Contrast plot obtained applying the SD and the ADI to the data taken with IFS operating in the YH-mode. The curves color codes are the same as in Fig. 5. The difference in time delays given in the label with respect to those in Fig. 5 is due to the different way in which the data have been taken at two epochs. See text for more detail. Different symbols are used to indicate positions of known planets on this plot.
Current usage metrics show cumulative count of Article Views (full-text article views including HTML views, PDF and ePub downloads, according to the available data) and Abstracts Views on Vision4Press platform.
Data correspond to usage on the plateform after 2015. The current usage metrics is available 48-96 hours after online publication and is updated daily on week days.
Initial download of the metrics may take a while.