Fig. A.2
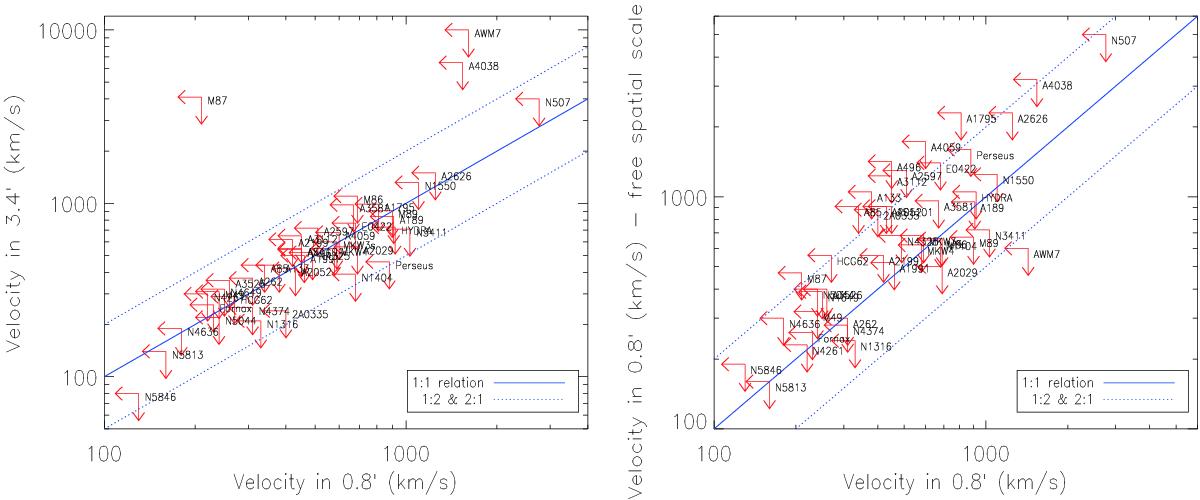
Left panel: velocity broadening at 2σ upper limits for the (−1.7′, +1.7′) and the (−0.4′, +0.4′) regions at comparison. The spatial broadening was removed through the MOS 1 surface brightness profiles. Right panel: (−0.4′, +0.4′) velocity 2σ upper limits compared with those estimated in the same region but with the variable best-fit, spatial broadening (scale parameter, s, is free in the lpro component, see Sect. 4.2 and Table A.1).
Current usage metrics show cumulative count of Article Views (full-text article views including HTML views, PDF and ePub downloads, according to the available data) and Abstracts Views on Vision4Press platform.
Data correspond to usage on the plateform after 2015. The current usage metrics is available 48-96 hours after online publication and is updated daily on week days.
Initial download of the metrics may take a while.