| Issue |
A&A
Volume 575, March 2015
|
|
|---|---|---|
| Article Number | A80 | |
| Number of page(s) | 28 | |
| Section | Extragalactic astronomy | |
| DOI | https://doi.org/10.1051/0004-6361/201425137 | |
| Published online | 27 February 2015 | |
Star formation in z > 1 3CR host galaxies as seen by Herschel⋆,⋆⋆
1
Kapteyn Astronomical Institute, University of Groningen,
9747 AD
Groningen,
The Netherlands
e-mail:
podigachoski@astro.rug.nl
2
Astronomisches Institut, Ruhr Universität,
44801
Bochum,
Germany
3
Max-Planck Institut für Astronomie (MPIA),
69117
Heidelberg,
Germany
4
Harvard-Smithsonian Center for Astrophysics,
Cambridge, MA
02138,
USA
5
Astrophysics Group, Imperial College London, Blackett
Laboratory, Prince Consort
Road, London
SW7 2AZ,
UK
6
Institute for Astronomy, Department of Physics, ETH Zurich,
Wolfgang-Pauli-Strasse
27, 8093
Zurich,
Switzerland
7
Jet Propulsion Laboratory, California Institute of
Technology, 4800 Oak Grove
Drive, Pasadena,
CA
91109,
USA
8
European Southern Observatory, Karl-Schwarzschild-Str. 2, 85748
Garching b. München,
Germany
Received: 10 October 2014
Accepted: 31 December 2014
We present Herschel (PACS and SPIRE) far-infrared (FIR) photometry of a complete sample of z> 1 3CR sources, from the Herschel guaranteed time project The Herschel Legacy of distant radio-loud AGN. Combining these with existing Spitzer photometric data, we perform an infrared (IR) spectral energy distribution (SED) analysis of these landmark objects in extragalactic research to study the star formation in the hosts of some of the brightest active galactic nuclei (AGN) known at any epoch. Accounting for the contribution from an AGN-powered warm dust component to the IR SED, about 40% of our objects undergo episodes of prodigious, ULIRG-strength star formation, with rates of hundreds of solar masses per year, coeval with the growth of the central supermassive black hole. Median SEDs imply that the quasar and radio galaxy hosts have similar FIR properties, in agreement with the orientation-based unification for radio-loud AGN. The star-forming properties of the AGN hosts are similar to those of the general population of equally massive non-AGN galaxies at comparable redshifts, thus there is no strong evidence of universal quenching of star formation (negative feedback) within this sample. Massive galaxies at high redshift may be forming stars prodigiously, regardless of whether their supermassive black holes are accreting or not.
Key words: galaxies: active / galaxies: high-redshift / galaxies: star formation / infrared: galaxies
Herschel is an ESA space observatory with science instruments provided by European-led Principal Investigator consortia and with important participation from NASA.
Tables 1, 2, 4 and Appendices are available in electronic form at http://www.aanda.org
© ESO, 2015
1. Introduction
The understanding that most (if not all) galaxies in the Universe host a supermassive black hole (SMBH) is among the most important findings of modern astronomy. The growth of a SMBH through mass accretion generates large amounts of energy during a phase in the evolution of the galaxy known as an active galactic nucleus (AGN) phase. Although there is a difference of a factor of ~109 in their physical size scales, the SMBHs and their host galaxies exhibit strong scaling relations (e.g. Magorrian et al. 1998; Tremaine et al. 2002; Gültekin et al. 2009), suggesting a link between the growth of the SMBHs and that of their host galaxies. Moreover, both these processes are thought to peak at redshifts z ~ 2 (e.g. Hopkins & Beacom 2006; Alexander et al. 2008). The symbiosis of black hole and global galaxy growth is intriguing because of the possible feedback effects: positive (AGN inducing star formation) and/or negative (AGN quenching of star formation). These feedback processes are of paramount importance for our understanding of galaxy formation (e.g. Croton et al. 2006; Hopkins et al. 2008). However, neither the feedback mechanisms nor the overall impact of feedback on the host galaxies is known. Other big unknowns are the duration and frequency of AGN accretion and host galaxy star formation phases.
High redshift radio-loud AGN (P1.4 GHz> 1025 W Hz-1 and z> 1) provide a unique opportunity to probe the interplay between the growth of the black hole and the hosting stellar bulge. They are invariably associated with massive galaxies having Mstellar ≳ 1011 M⊙ (Best et al. 1998; Seymour et al. 2007; De Breuck et al. 2010), and have edge-brightened, double-lobed, FRII morphologies (Fanaroff & Riley 1974) that permit estimates of the duration of the episode of strong AGN activity. In addition to being used in studies of massive galaxy evolution, radio-loud AGN are being used extensively in unification studies, where distant radio-loud galaxies and quasars are believed to make up one and the same population (Barthel 1989; Antonucci 1993; Urry & Padovani 1995), hence have equally massive hosts. Ultraviolet or visible opaque circumnuclear dust is an essential element of this scenario; distant 3CR quasars and radio galaxies are indeed luminous mid-infrared (MIR) emitters (Siebenmorgen et al. 2004; Haas et al. 2008; Leipski et al. 2010).
It has long been suspected that hosts of powerful high-redshift radio-loud AGN undergo episodes of vigorous (dust obscured) star formation (e.g. Archibald et al. 2001). Huge reservoirs of molecular gas, have been deduced in several objects from submillimetre (submm) studies (e.g. Reuland et al. 2004). Such studies were mainly based on one submm flux measurement and were limited to the highest redshift objects for which the obscured newborn star radiation re-emitted by the ubiquitous cold (30–50 K) dust is redshifted to submm wavelengths. However, quantification of the cold dust emission (e.g. constraining the cold dust temperature) requires sampling the full rest-frame infrared-submm spectral energy distribution (SED) of the studied objects. Earlier far-infrared (FIR) studies failed to provide strong constraints on the FIR properties for relatively large samples of powerful radio-loud AGN because of their small detection fractions and only limited rest-frame FIR wavelength coverage (Heckman et al. 1992; Hes et al. 1995; Meisenheimer et al. 2001; Siebenmorgen et al. 2004; Haas et al. 2004; Cleary et al. 2007).
The Herschel Space Observatory (Pilbratt et al. 2010), with its unprecedented FIR sensitivity and wavelength coverage, explored terra incognita (caelum incognitum...) allowing studies which have revolutionized the understanding of the connection between AGN and star formation activity. Several studies utilizing deep X-ray and Herschel data revealed that the hosts of moderately luminous radio-quiet AGN out to z ~ 3 form stars at rates comparable to the general non-AGN population (Shao et al. 2010; Mullaney et al. 2012; Rosario et al. 2012). For high (radio-quiet) AGN luminosities (LX> 1044 erg s-1), Page et al. (2012) reported suppression of star formation, consistent with the expectations from theoretical models, while Harrison et al. (2012) found no clear evidence of suppression of star formation by extending the analyses to samples larger by an order of magnitude. Moreover, at the highest AGN luminosities (in excess of 1046 erg s-1), recent studies based on decomposition of the IR emission to AGN and star formation contributions, have shown star formation rates (SFRs) of the order of several hundred solar masses per year in the hosts of some of the most powerful radio galaxies (Barthel et al. 2012, B12 hereafter; Seymour et al. 2012; Drouart et al. 2014) and (radio-quiet) quasars (Leipski et al. 2013, 2014).
In order to quantify the energetics of AGN at the peak of their activity as well as their star formation characteristics, we obtained five-band Herschel photometry of the 3CR sample using the Photodetector Array Camera (PACS) at 70 and 160 μm and the Spectral and Photometric Imaging Receiver (SPIRE) at 250, 350, and 500 μm on-board the Herschel Space Observatory. The first results, dealing with 3 archetypal objects of that sample were presented in B12. Here we analyse the FIR properties of the complete (flux-limited) sample of objects spanning the redshift range 1 <z< 2.5. This paper is organized as follows. Section 2 describes the sample selection, the data obtained, and the steps used for measuring flux densities in the five Herschel bands. Section 3 addresses the procedure for fitting the observed IR SEDs of the objects. Results are then presented and discussed in Sect. 4 and Sect. 5, respectively, and the paper is briefly summarized in Sect. 6. Throughout this paper we use a flat cosmology with H0 = 70 km s-1 Mpc-1 and ΩΛ = 0.7, and we follow the conversion in Kennicutt (1998; which assumes a Salpeter 1955 initial mass function) when deriving SFRs.
2. Data
2.1. Sample selection
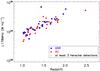 |
Fig. 1 Observed radio (178 MHz) luminosity as a function of redshift for the 3CR sample considered in this work. Circles (red) indicate radio galaxies, and squares (blue) indicate quasars. The plus symbols mark the objects detected in at least three Herschel bands (typically the two PACS and the SPIRE 250 μm bands). |
With this study, we target the well known, complete flux-limited sample of the brightest (F178 MHz> 10 Jy), high-redshift (z> 1) radio-loud AGN sample in the northern hemisphere: the Revised Third Cambridge Catalogue of radio sources (hereafter 3CR; Spinrad et al. 1985). The extremely high luminosities (Fig. 1) of these double-lobed radio galaxies (RGs) and quasars (QSRs) are produced by some of the most powerful accreting SMBHs. The low-frequency (178 MHz) radio selection ensures no bias with respect to orientation: the steep-spectrum lobes of radio-loud AGN emit optically thin and isotropic synchrotron radiation, making the 3CR sample ideal for testing the orientation-based unification scenario of radio-loud AGN. As shown in Fig. 1, both the RGs and QSRs are homogeneously distributed in redshift. The z> 1 3CR objects show mostly FRII morphologies; this is well-established from, for instance, high-resolution VLA maps. Compact, presumably young, morphologies (O’Dea 1998) are also found within the sample.
The z> 1 3CR sample is (spectroscopically) completely identified using 3 to 5 m-class telescopes in the 1960s–1980s (Spinrad et al. 1985). The objects in the sample almost universally accrete at high Eddington rate, i.e. in quasar-mode (e.g. Best & Heckman 2012). The total number of objects in the z> 1 3CR sample is 641. The highest redshift 3CR source is 3C 257 (z = 2.47). Two z> 1 3CR sources, 3C 287 and 3C 300.1, have been observed in other Herschel observing modes, and thus have been dropped from this work. The remaining 62 sources, 37 RGs and 25 QSRs, comprise the Herschel sample studied in this work. An overview of selected properties is provided in Table 1.
The high-z 3CR sample has been observed with many space telescopes (including Hubble, Spitzer, and Chandra; Best et al. 1998; Haas et al. 2008; Leipski et al. 2010; Wilkes et al. 2013): objects from this sample represent landmarks in our study of active galaxies through cosmic time.
2.2. Herschel photometry
The data for this work were obtained as part of our Herschel guaranteed time project The Herschel Legacy of distant radio-loud AGN (PI: Barthel, 38 h of observations). Five objects (see Table 1) were observed as part of another Herschel programme (PI: Seymour). The raw data for these objects were retrieved from the Herschel Science Archive, and the data reduction was performed as detailed below.
2.2.1. PACS
Photometric observations were carried out with PACS (Poglitsch et al. 2010) in the scan-map observational mode, both in the blue (70 μm, 5″ angular resolution) and in the red (160 μm, 11″ angular resolution) bands. A concatenated pair of coextensive scan maps at two different orientations was obtained for each source. Data reduction was performed within the Herschel interactive processing environment (HIPE, Ott 2010, version 11.0.0), following the standard procedures for deep field observations. Maps were created by employing the high-pass filtering method, using an appropriate source masking step to avoid significant flux losses due to the high-pass filter. A first data reduction resulted in a preliminary map, created after combining the individually (for each scan orientation) processed scan maps. Source masking was performed by hand, using the preliminary created map as an input. This method in particular allowed us to minimize the flux losses of the observed sources (Popesso et al. 2012). The final data reduction and mosaicking were then performed using the mask generated in the previous step.
Photometry (using appropriate aperture corrections) was performed within HIPE, using the annular Sky Aperture Photometry task. Apertures of 6″ and 10″ radius for PACS blue and PACS red, respectively, were centred on the known radio core position of the object in the map. PACS maps suffer from correlated noise, thus pixel-to-pixel variations cannot yield robust photometric uncertainties. Instead, we opted for the well-established procedure of placing apertures at random positions on the sky (Lutz et al. 2011; Popesso et al. 2012). Following Leipski et al. (2013), we placed 500 apertures of 6″ (for blue) and 10″ (for red) radii at locations avoiding the noisy edges of the map, requiring that the central pixel of the random aperture has at least 75% of the integration time of that of the source of interest. The resulting distribution of the flux densities measured in these 500 apertures was then fitted with a Gaussian, and the sigma value of the Gaussian was taken to be the 1σ photometric uncertainty of the map. Measured flux densities and associated 1σ uncertainties, together with 3σ upper limits for the non-detections are provided in Table 2. The PACS photometric uncertainties provided in Table 2 do not include the 5% uncertainty on the absolute flux calibration (Balog et al. 2013). Postage stamps of the resulting PACS maps, centred on the radio position of the objects, are included in Appendix E.
2.2.2. SPIRE
SPIRE (Griffin et al. 2010) photometric observations were carried out in small scan-map observational mode, at 250 (18.2″ angular resolution), 350 (24.9″ angular resolution) and 500 μm (36.3″ angular resolution). Data reduction was performed in HIPE following standard procedures for SPIRE data. Source extraction on the fully reduced map was performed using the sourceExtractorSussextractor task (Savage & Oliver 2007). Extracted sources located within half the full width at half maximum (FWHM) of the given SPIRE array (measured from the radio core position of the sources) were selected as tentative detections.
While SPIRE does not suffer from correlated noise, SPIRE observations are dominated by confusion noise, of the order of 6–7 mJy beam-1, as estimated from deep extragalactic observations (Nguyen et al. 2010). Our adopted procedure for the determination of the photometric uncertainties in the SPIRE maps is fully described by Leipski et al. (2013), which in turn follows the procedures presented by Elbaz et al. (2011) and Pascale et al. (2011). Initially, an artificial source free map was created by removing the extracted sources in a SPIRE map from the map itself. Then, the pixel-to-pixel rms in this source free map was calculated using a box centred on the nominal position of the target object. The size of the box was chosen as a compromise between avoiding the noisy edges of the SPIRE map and obtaining proper statistics of the immediate environment of the target object.
As indicated in Table 2, three SPIRE detections are formally below the estimated 3σ values. These particular measurements were included in the subsequent analyses because, upon visual inspection, they showed obvious emission at the known position of the target object. The availability of ancillary multi-wavelength data at shorter wavelengths (to check for source confusion), and the understanding of the overall shape of the object’s SED, further support the inclusion of these flux densities in the subsequent analyses. While the formal signal-to-noise ratio of one of these three detections is very close to three, the other two detections do not reach this ratio only because the associated SPIRE maps are less clean than other maps in the sample, leading to significantly larger photometric uncertainties. The SPIRE 500 μm photometry should be considered tentative because the beam at this particular wavelength is large, and undetected sources in the region surrounding the AGN may contribute to the measured flux density. The SPIRE photometric uncertainties provided in Table 2 do not include the 4% uncertainty on the absolute flux calibration (Bendo et al. 2013). Postage stamps of the resulting SPIRE maps, centred on the radio position of the objects, are included in Appendix E.
2.3. Supplementary data
The FIR photometry of all 3CR sources in our work was supplemented with MIR photometry obtained with the Spitzer Space Telescope (Werner et al. 2004) during three Spitzer GT observing programmes (PI: G. Fazio) in six bands, using the instruments IRAC (Fazio et al. 2004), IRS-16 peak-up array (Houck et al. 2004), and MIPS (Rieke et al. 2004). Details on the Spitzer data reduction and photometry have previously been published by Haas et al. (2008). Table 2 lists the Spitzer photometry. When available, additional 850 μm data were collected from the literature. The 850 μm emission in quasars can be heavily contaminated by synchrotron contribution (see Sect. 3.3). The quasar 850 μm thermal flux densities utilized in this work were taken from Haas et al. (2006). To obtain the 850 μm thermal flux densities of quasars, Haas et al. (2006) extrapolated the synchrotron contribution at 850 μm using the measured radio core flux densities, and subtracted it from the total flux density at 850 μm. Table 3 lists the radio galaxy and quasar thermal submm flux densities used in this work.
Objects with significant thermal submillimetre flux densities.
3. Spectral energy distributions
3.1. Fitting components
The estimation of physical properties for the active galaxies was performed using an SED fitting technique. Our fitting routine is based on a combination of several distinct components, responsible for the emission from active galaxies in different wavelength regimes. Below, we describe this multi-component approach of fitting the observed IR SEDs.
The presence of circumnuclear dust surrounding the broad line regions in AGN and blocking their UV/visible emission is central to orientation-based unification of powerful FRII radio galaxies and quasars (Barthel 1989; Antonucci 1993). Given its proximity to the AGN, the emission from this AGN-illuminated warm dust peaks at rest-frame MIR (10–40 μm) wavelengths (e.g. Rowan-Robinson 1995). Spitzer photometric and spectroscopic data have shown that the majority of high-z 3CR objects are luminous MIR emitters (Haas et al. 2008; Leipski et al. 2010), with observed MIR luminosities L15 μm much higher than 8 × 1043 ergs s-1, the value separating hidden quasars from MIR weak radio galaxies at intermediate redshifts (Ogle et al. 2006). There exists broad agreement that the AGN-heated nuclear dust is mainly located in clumps which are distributed in a toroidal pattern altogether referred to as the AGN torus (e.g. Nenkova et al. 2002; Kuraszkiewicz et al. 2003; Hönig et al. 2006; Schartmann et al. 2008). To account for the emission from the AGN heated dust, we chose the library of torus models from Hönig & Kishimoto (2010). The parameters considered when creating this library include the (1) radial dust distribution of dust clumps; (2) geometric thickness of the torus; (3) number of clumps along an equatorial line of sight; (4) optical depth of the individual clumps; and (5) outer radius of the torus. There are 240 sets of parameters in the library, each computed for seven viewing-angles ranging from face-on (i = 0°) to edge-on (i = 90°) in steps of 15 deg, resulting in a total of 1680 torus models. Detailed information on the model parameters and the adopted strategy in generating the tori SEDs is provided by Hönig & Kishimoto (2010). In addition to the parameters listed above, the overall flux normalization of the model is another free parameter throughout the fitting procedure (outlined below).
The rest-frame FIR emission (40–500 μm) is largely generated by cold dust, heated by star formation on kpc-scales in the AGN host (e.g. Rowan-Robinson 1995; Schweitzer et al. 2006; Netzer et al. 2007). Following these authors, we interpret any FIR emission (in excess of the emission of the AGN-heated dust) as being powered by star formation, and we represent it with an optically thin modified blackbody component, i.e., a blackbody modified by frequency-dependent emissivity, given by  (1)We reduce the number of free parameters in this component by fixing the dust emissivity index β to a typical value of 1.6 as found in studies of high-z AGN (e.g. Beelen et al. 2006). The remaining two free parameters here are the cold dust temperature and the flux normalization of the modified blackbody component. The use of a modified blackbody, as opposed to starburst templates (e.g. Drouart et al. 2014), might slightly underestimate the star formation luminosities because one misses the starburst MIR emission, but offers the unique possibility of constraining the cold dust temperatures.
 |
Fig. 2 IR spectral energy distributions (SEDs, solid black) for two representative objects from this work. Open circles show the photometric data. Error bars correspond to 1σ photometric uncertainties. Arrows indicate 3σ upper limits. Left panel: 3C 454.1, a radio galaxy at z = 1.84. The three components used to fit the SEDs of radio galaxies account for emission from host galaxy (old) stars (dash-dotted red), from an AGN-heated torus (dotted green), and from dust heated by star formation (dashed yellow). Right panel: 3C 205, a quasar at z = 1.53. The multi-component approach used to fit quasars accounts for emission from hot (1300 K) dust (long-dashed blue), from the AGN-heated torus (dotted green) and from the star formation heated dust (dashed yellow). |
 |
Fig. 3 Distributions of individual physical parameters obtained from the SED fits, for radio galaxies (red) and quasars (blue). The values plotted are those for the objects detected in at least three Herschel bands. Upper left panel: temperature of the cold dust component emitting in the FIR, Tdust. Upper right panel: mass of the FIR emitting cold dust component, Mdust. Lower left panel: AGN-powered IR luminosity, LAGN. Lower right panel: star-formation-powered IR luminosity, LSF. The vertical lines in the lower panels correspond to the average values of the FIR-detected (solid lines) and non-detected (dashed lines) stacked subsamples discussed in Sect. 4.4. |
The two components described above feature in the SED fitting of both radio galaxies and quasars. We include additional SED components to the fitting depending on the type of the studied object. For radio galaxies, we added a blackbody component peaking in the near-IR (NIR) to account for the emission from the old stellar population in the AGN host (e.g. Seymour et al. 2007). The temperature of the blackbody and its flux normalization are the two free parameters for this SED component. For quasars, we added a blackbody component to account for the hot (graphite) dust close to the sublimation temperature. This component is often empirically required to fit the observed SEDs of quasars (e.g. Mor & Netzer 2012; Leipski et al. 2013). Following these authors, we fixed the temperature of the blackbody to 1300 K, leaving its flux normalization as the only free parameter during the fitting. Such a component is also needed in the fitting of the SEDs of a few radio galaxies (see also B12) whose observed photometry in the NIR/MIR could not be well represented with the components described above. These radio galaxies, indicated in Table 4, might be viewed along lines of sight at which the nuclear region is only partly obscured, thus resulting in somewhat elevated MIR luminosities. The inclusion of the hot dust component to the SEDs of some of the radio galaxies might lower the estimates of the mass of the evolved stellar populations, but this is outside the scope of this work. For the quasars we also considered an additional power-law component representing the emission from an accretion disk in the UV/visible. However, as demonstrated in Appendix A, the inclusion of this power-law component had little influence on the results obtained from the FIR part of the SED, therefore it was excluded from the fitting procedure.
3.2. Fitting procedure
While our physically motivated fitting approach results in a close approximation of the observed SEDs of the sample objects, it is not primarily designed to yield precise models of their SEDs. In particular, we are not interested in constraining the properties of the dusty torus with our multi-wavelength broad-band photometry. This kind of analysis remains challenging even at lower redshifts (e.g. Ramos Almeida et al. 2009). Torus models are used to separate AGN-heated dust emission (peaking in MIR) from star-formation-heated dust emission (peaking in FIR), and to determine for the first time the star-formation-dominated FIR energetics of the high-z 3CR sources. When fitting the observed SEDs of our objects, we used a chi-square minimization technique based on the MPFIT routine (Markwardt 2009). In practice, we started with a torus model from the library of Hönig & Kishimoto (2010) and added a linear combination of the remaining SED components (depending on the object type) to minimize the overall chi-square. We repeated the procedure for each torus model in the library.
Example best-fit SEDs, along with their individual SED components, are shown in Fig. 2. At the redshifts of our sample, the PACS 70 μm band is crucial in our adopted fitting approach, as it strongly constrains the longer wavelengths of the torus emission. On the other hand, the SPIRE 250 μm band is the most important measurement for constraining the component representing the cold dust emission. Therefore, our fitting approach was applied to all objects that are detected in at least three Herschel photometric bands (typically the three shortest Herschel bands). These objects are homogeneously distributed in the redshift range (1 <z< 2.5) studied in this work (Fig. 1). Best-fit SEDs for these objects, together with images centred on the radio positions of the AGN, are presented in Appendix C and in Appendix E, respectively. Occasional SED mismatches at observed-frame 16 μm and/ or 24 μm are most probably due to luminous polycyclic aromatic hydrocarbon emission and/or the 10 μm silicate absorption (Haas et al. 2008; Leipski et al. 2010). At FIR wavelengths, the fixed β approach may be the main reason behind the failure of the fitting routine to exactly reproduce some SPIRE data points.
The physical parameters constrained by our fitting method include IR star formation and IR AGN luminosity, and the temperature and mass of the cold dust component (Fig. 3, Table 4). Uncertainties in the derived parameters were calculated by resampling the observed SEDs, allowing the individual photometric measurements to vary within their 1σ ranges of uncertainty. More precisely, we generated 100 mock observed SEDs and studied the distributions of the parameters derived from the corresponding best fits. We inspected the best fits to the mock SEDs to confirm their overall quality in the different wavelength regimes. From the distributions, we retained the median values as the best estimates of the parameters, and the 16th–84th percentile ranges as their associated uncertainties (which in case of a Gaussian distribution would correspond to ± 1σ values).
For objects with fewer than three Herschel detections, we estimated upper limits for the IR star formation and IR AGN luminosities using two different approaches. In the first approach, we fitted the (longer wavelength) Herschel upper limits using a modified blackbody with fixed β = 1.6 value and fixed cold dust temperature (Tdust = 37 K), typically found from the fits of the objects detected in at least three Herschel bands (see below). We then integrated under the blackbody component to estimate upper limits for the star formation luminosities. In the second approach, we took the 70/160/250 μm upper limits as tentative detections, and estimated upper limits for the star formation luminosities using the procedure adopted for the objects detected in at least three Herschel bands. Both approaches yielded similar results (within 10%) for the star formation luminosities, but we retained the second approach because it allowed us to estimate the IR AGN luminosities for objects with only PACS 70 μm detections. Best-fit SEDs for objects with fewer than three Herschel detections, together with images centred on the radio positions of the AGN, are presented in Appendix D and in Appendix E, respectively. Systematically demanding three Herschel detections when fitting the observed photometry regardless of redshift means that the FIR results for the objects detected in only the two PACS bands are treated as upper limits. However, depending on the object’s redshift, the PACS 160 μm band alone may probe the peak of the cold dust emission, allowing robust constraints for the physical parameters estimated in this work.
3.3. Synchrotron contribution
Earlier submillimetre and millimetre studies of high-redshift 3CR sources presented clear evidence for a synchrotron contribution to the observed flux densities (van Bemmel et al. 1998; Archibald et al. 2001; Willott et al. 2002; Haas et al. 2006). While negligible for radio galaxies, extrapolation from core radio data shows that synchrotron emission can account for up to 80% of the observed submm flux densities from quasars (Haas et al. 2006). However, the longest rest-frame wavelengths probed by the SPIRE 500 μm band in our study are ~200 μm: emission at these wavelengths is completely dominated by dust and therefore free from any synchrotron contribution. The only exception is 3C 418. This source appears to be flat-spectrum-core-dominated (in an otherwise steep-spectrum selected sample), and as such its FIR SED is clearly dominated by non-thermal (synchrotron) radiation from its core. The power-law like IR SED of this source is shown in Appendix C. 3C 418 was removed from the subsequent analyses.
4. Results
4.1. Detection statistics
The Herschel detection rate throughout our sample ranges from 67% in the PACS 70 μm band to 13% in the SPIRE 500 μm band. In particular, 7 objects have robust detections in all five Herschel bands. Furthermore, a total of 24 objects are detected in at least three Herschel bands, most importantly in the SPIRE 250 μm band, which for the highest redshift of our sample (3C 257: z = 2.47) corresponds to ~70 μm rest-frame emission2. Excluding 3C 418 from these 24 objects, results in 13 radio galaxies and 10 quasars. The Spitzer detection rate throughout our sample ranges from 94% in the IRS 16 μm and MIPS 24 μm bands to 100% in the IRAC 5.8 μm band. Comments on selected individual objects are included in Appendix B.
4.2. Physical properties obtained from the SED fitting
Studies investigating the cold dust temperatures in high-z objects prior to Herschel were often uncertain because they relied heavily on observations in a single photometric broadband (e.g. Benford et al. 1999; Beelen et al. 2006). In our current study, cold dust temperatures estimated for the FIR-detected objects range from ~25 to ~45 K (Fig. 3, Table 4). Radio galaxies and quasars span the same range in cold dust temperatures, This range is similar to that obtained for z> 5 quasars (Leipski et al. 2014) and to that estimated for distant submm galaxies (e.g. Magnelli et al. 2012). Similarly to Leipski et al. (2013), the inclusion of the 1300 K hot dust component in the SED fitting lowers the estimates of the cold dust temperatures by ~5 K. By including the hot dust component, we preferentially select torus models that emit more of their energy at longer wavelengths. As a consequence, the cold dust components are also shifted to colder temperatures.
Central to the subsequent discussion are the star formation luminosities, LSF, which we computed (or estimated upper limits) by integrating the best-fit modified blackbody components from 8 μm through 1000 μm. Figure 3 shows the distribution of LSF for the radio galaxies and quasars detected in at least three Herschel bands. Both types of objects show similarly broad distributions, with many objects having LSF> 1012 L⊙, characterizing them as ultra-luminous infrared galaxies (ULIRGs; see also Table 4). The median star formation luminosities of the RGs and QSRs plotted in Fig. 3 are 2.0 × 10¹² L⊙ and 2.6 × 10¹² L⊙, respectively. Converting the star formation luminosities into SFRs using the calibration derived by Kennicutt (1998) gives 100 M⊙ yr-1<SFR< 1000 M⊙ yr-1, consistent with SFRs obtained for typical submm galaxies (SMGs) at comparable redshifts (e.g. Magnelli et al. 2012).
To compute the IR luminosities of the components powered by the AGN, LAGN, we integrated the best-fit torus component for the RGs and the sum of the best-fit hot dust and torus component for the QSRs3 between 1 μm and 1000 μm. Figure 3 shows that the RGs and QSRs occupy different ranges in the distributions of LAGN, with the distribution for QSRs shifted to higher values compared to that for RGs. Haas et al. (2008) already established this result by investigating the (energetically important) rest 1.6–10 μm wavelength range for the high-z 3CR objects, finding the QSRs to be, on average, 3–10 times more luminous than RGs. We confirm their finding by including rest-frame wavelengths longer than 10 μm. The median IR AGN luminosities of the RGs and QSRs plotted in Fig. 3 are 3.7 × 10¹² L⊙ and 1.1 × 10¹³ L⊙, respectively.
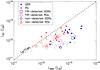 |
Fig. 4 IR emission from star-formation-heated cold dust, LSF, versus IR emission from AGN-powered dust, LAGN, for radio galaxies (filled red circles) and quasars (filled blue squares). Upper limits have been estimated as explained in the text. The large empty symbols correspond to the subsamples of FIR-detected RGs (circle) and QSRs (square), and non-detected RGs (triangle) and QSRs (diamond) discussed in Sect. 4.4. The dashed line marks LSF = LAGN. |
As outlined in previous sections, we attribute the FIR emission in excess of the AGN-powered dust emission to emission from star-formation-heated dust. Figure 4 shows LSF as a function of LAGN for all objects in our sample. The presence/absence of correlation between these two parameters depends on both redshift and AGN luminosity, and is still debated in the literature (Lutz 2014). Given the data, and taking into account only the FIR-detected objects, the two plotted parameters show at most a weak correlation, in part introduced by the dependence of both LSF and LAGN on redshift. Moreover, the numerous upper limits, together with the fact that both parameters span only a limited range (~2 orders of magnitude), make it difficult to establish any such correlation (or lack of) in our sample. Nevertheless, we observe a range of LSF from weak (if not absent) to very strong, coeval with the growth of the black hole. Figure 4 also shows that the hosts of even the strongest AGN can have significant star formation activity, unlike the trends found by Page et al. (2012) for radio-quiet AGN. In general, the total IR emission from the 3CR AGN is predominantly AGN powered, despite the frequently accompanying strong star formation activity.
We estimated the mass of the FIR emitting dust component, Mdust, using 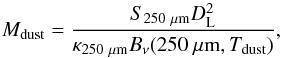 (2)where S250μm is the flux at 250 μm rest-frame found from the best-fit, DL is the luminosity distance, κ250 μm is the dust absorption coefficient at 250 μm (κ250 μm = 4 cm2 g-1 from the models of Draine 2003), and Bν(250 μm,Tdust) is the value of the Planck function at the corresponding rest-frame wavelength and temperature. Results are shown in Table 4. Given that the RGs and QSRs in our sample cover roughly the same redshift range and show similar star formation properties, it is no surprise that their cold dust masses are comparable as well. More interestingly, the masses of the cold dust component in the hosts of radio-loud AGN detected in at least three Herschel bands are comparable to those obtained for SMGs at redshifts similar to those of our sample (e.g. Santini et al. 2010). The dust masses of radio-loud AGN provide clues to the triggering of the starburst event (and also that of the black hole activity, Tadhunter et al. 2014). Given that the high-z SMGs are likely undergoing strong merger-induced starburst events (e.g. Kartaltepe et al. 2012), their similar dust content suggests that that FIR-luminous radio-loud AGN also build up their stellar mass in major gas-rich mergers.
4.3. Median SEDs
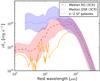 |
Fig. 5 Median spectral energy distributions (SEDs) for the radio galaxies (dashed red) and quasars (dotted blue) detected in at least three Herschel bands, and for z ~ 2 star-forming galaxies (solid yellow) from Kirkpatrick et al. (2012). Shades areas, red for radio galaxies and blue for quasars, correspond to the associated 16th–84th percentile ranges. |
The best-fit SEDs for the objects detected in at least three Herschel bands are shown in Appendix C. The SEDs show a considerable range of shapes and absolute scaling, with all QSR (and a few RG) SEDs peaking at wavelengths around 20 μm, and most RG SEDs peaking at longer wavelengths. Furthermore, the SEDs show that the AGN-powered and star-formation-powered dust emission switch dominance typically at 50 μm, (but this can happen at all wavelengths between 35 and 65 μm). Given that all SEDs were computed on the same rest-frame wavelength grid, we created median SEDs for the two types of objects to prevent the most extreme objects dominating the average SEDs. When creating the median SEDs, we refrained from applying any normalization, in order to preserve the absolute luminosities of the individual SEDs. The median4 SEDs are shown in Fig. 5.
The median SEDs of RGs and QSRs differ strongly at rest-frame 3–10 μm, with the QSRs being a few times more luminous than the RGs. Such an observational difference in this wavelength regime has already been explained by Haas et al. (2008) in the context of unification by orientation. In this scenario, the observed luminosity differences result from viewing the QSRs and RGs along different angles, such that the hot inner regions of the dusty torus are observed directly in the case of QSRs but are obscured in the case of RGs. As found by Leipski et al. (2010), similar observational differences correlate with orientation indicators, such as the radio core dominance. The median SED of RGs can therefore be viewed as the median SED of reddened QSRs (Haas et al. 2008; Leipski et al. 2010). At rest-frame wavelengths between 10 and 40 μm, the median RG and QSR SEDs still show a considerable anisotropy, with the QSRs being a factor of two more luminous compared to the RGs at 20 μm. At rest-frame FIR wavelengths (≳40 μm), however, the median RG and QSR SEDs appear to be remarkably similar both in shape and absolute scale, arguing for, on average, similar star formation properties for the hosts of both types of AGN.
Figure 5 also shows the average SED for the subsample of the z ~ 2 star-forming galaxies from Kirkpatrick et al. (2012). This average SED is composed of 30 (U)LIRG galaxies, initially selected based on their 24 μm flux density (F24 μm ≳ 100 μJy), for which good multi-wavelength coverage is available throughout much of the IR regime. Representing the star-formation-heated cold dust emission with a modified blackbody, Kirkpatrick et al. (2012) estimate the average SFR and cold dust temperature of these galaxies to be 344 ± 122 M⊙ yr-1 and 28 ± 2 K, respectively. Comparing these (U)LIRG numbers to those obtained for the FIR-detected 3CRs in our work, we find comparable SFRs but on average higher cold dust temperatures. Furthermore, Fig. 5 confirms the marked difference between the (U)LIRGs and 3CRs in the NIR/MIR luminosity: while the z ~ 2 star-forming galaxies are characterized by pronounced polycyclic aromatic hydrocarbon (PAH) features, the powerful emission from the warm dusty torus completely outshines these features in the MIR SED of the 3CR host galaxies. Finally, the average stellar mass of the z ~ 2 star-forming galaxies is a factor of ~3 smaller than that of the RG hosts as seen from the offset in the respective SEDs at around 1.6 μm. While AGN contamination to the 1.6 μm is not accounted for in this discussion, the very steep median SED of radio galaxies between 4 and 6 μm suggests that any contribution from hot dust to the 1.6 μm flux is negligible. AGN contamination at 1.6 μm likely is present in individual cases, but does not appear to be crucial when discussing average properties. Overall, the comparison between the 3CR and the Kirkpatrick et al. (2012) sample shows that massive galaxies in the high-z Universe may be actively forming stars regardless of whether their SMBHs are accreting or not.
4.4. Stacking of non-detected objects
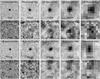 |
Fig. 6 Stacked images in all Herschel bands, for the four subsamples discussed here. From left to right: PACS 70 μm, PACS 160 μm, SPIRE 250 μm, SPIRE 350 μm, and SPIRE 500 μm bands, respectively. From top to bottom: FIR-detected radio galaxies, non-detected radio galaxies, FIR-detected quasars, and non-detected quasars. Each stacked image shown here has dimensions of 2 × 2 arcmin and is centred on the known radio positions of the objects entering the stack. |
In addition to probing the general properties of the objects that are individually detected in at least three Herschel bands, we attempt a stacking analysis to extract an average signal for the objects which lack significant emission in the Herschel bands. For convenience, we refer to the former objects as FIR-detected, and to the letter as non-detected. Our aim is to discuss average properties for each radio-loud AGN type, therefore we split the non-detected objects into RGs and QSRs, respectively. In order to retain decent number statistics in the two subsamples, we decided not to further divide the RGs and QSRs in redshift bins, despite the considerable redshift range of our sample. In practice, we take the non-detected objects to be those that are detected in at most one, namely the PACS 70 μm band, which given the redshifts of our sources often probes the peak emission from the dusty torus. Several RGs and QSRs were not included in the stacking analysis owing to the presence of potentially confusing sources in the corresponding maps, close to the known radio position of the object in question. Furthermore, two RGs (3C 252 and 3C 267) with a strong detection in only the PACS 70 μm band were not included in the stacking because they are inconsistent with forming a single population with the objects which have no Herschel detections. As a result, stacking was performed on subsamples of 12 RGs and 6 QSRs with median redshifts of zmed = 1.44 and zmed = 1.27, respectively. The objects entering the subsamples are flagged in Table 4. For comparison, we also selected two subsamples from the FIR-detected objects: a subsample with 13 RGs (zmed = 1.34) and another one with 8 QSRs (zmed = 1.52; 3C 298 and 3C 318, sources with strongly emitting nearby objects, were not taken into consideration).
We stacked equal areas extracted from the individual Herschel maps, centred on the known radio position. Photometry on the stacked map was performed following the same procedures as adopted in the case of the individually detected objects (Sect. 2). We examined the diversity within the given subsample by bootstrapping with 1000 realizations. In practice, from the original subsamples identified above, for each bootstrapping realization we selected a random subsample (with the same number of objects, allowing for repetitions), stacked the Herschel maps, and performed the photometry. The centroid and the dispersion of the resulting distribution were taken to be the mean flux density of the on-source stack and its associated uncertainty. Additionally, we stacked at random positions in order to inspect the overall significance of the on-source stacked signal. If the mean value of the on-source stack distribution was at least three times larger than the mean value of the corresponding background stack distribution, we concluded that the on-source signal is significant. In cases of a non-significant signal, we took three times the mean value of the background stack distribution to be our on-source stack upper limit value.
The mean stacks for the four different subsamples selected in our study are presented in Fig. 6. The non-detected quasars have a significant stacked signal in only the PACS 70 μm band, whereas the non-detected radio galaxies have no significant signal in any of the Herschel bands. On the other hand, the FIR-detected quasars and radio galaxies have significant stacked signals in all, and in all but the SPIRE 500 μm band, respectively. In order to study the full IR SED of a stacked subsample, we calculated mean flux densities in the Spitzer bands, where virtually all objects have been individually detected. All obtained average fluxes are in the observed frame: these were transferred to the rest-frame, using the median redshift of the corresponding subsample. The SEDs of the stacked subsamples are shown in Fig. 7.
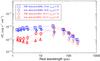 |
Fig. 7 Spectral energy distributions of stacked subsamples selected from the hosts of the 3CR sources studies here. The four subsamples presented are: FIR-detected radio galaxies (red circles), non-detected radio galaxies (red triangles), FIR-detected quasars (blue squares), and non-detected quasars (blue diamonds). Arrows mark 3σ upper limits as explained in the text. |
The 1–10 μm SEDs of radio galaxies are composed of emission from an evolved stellar population and from a heavily reddened AGN (Haas et al. 2008). At the rest-frame wavelengths (given the comparable median redshifts of the various subsamples) probed by the two shortest wavelength Spitzer bands (<2 μm), the FIR-detected and non-detected subsamples of RGs are similar. Thus, it is likely that the stellar masses of the host galaxies for the two RG subsamples are, on average, similar as well. Identifying differences in the host galaxy stellar masses requires additional NIR photometry, and is outside the scope of this work. At wavelengths between 2 and 10 μm, the SEDs of the two RG subsamples differ from each other. At these wavelengths, AGN-heated hot dust emission appears to be present/absent in the SED of the FIR-detected/non-detected subsample, respectively, reflecting different levels of dust obscuration, as inferred from the diversity in the individual MIR SEDs of RGs (Haas et al. 2008). Particularly interesting is the non-significant stacked signal for non-detected RGs at rest-frame 30 μm, which could indicate that the two subsamples have different intrinsic AGN luminosities. Indeed, fitting the SEDs following the routine taken in Sect. 3 gives (at least) a factor of two difference between the estimated LAGN in the two RGs subsamples (Table 5, Fig. 4). A clear difference between the SEDs of the two subsamples of RGs is observed at rest-frame wavelengths longer than 60 μm, suggesting marked differences in the star formation properties of the two subsamples. This results in (at least) a factor of three difference between the estimated SFRs in the two RGs subsamples (Table 5, Fig. 4). The SEDs of the two QSR subsamples generally follow the same trends as those observed for the RG subsamples. While the non-detected QSRs could overall be at the fainter end of the QSR population, the most striking difference in the QSR SEDs is at FIR wavelengths, with the FIR-detected QSRs having SFRs (at least) a factor of three higher than the non-detected QSRs. While more analysis is required to pin down the potential differences among the subsamples in wavelengths other than FIR, it is beyond doubt that the formation of new stars can be prodigious in some, but modest or weak in other radio-loud AGN hosts.
Results from the SED fitting of the stacked subsamples.
5. Discussion
5.1. Star formation in hosts of powerful AGN
Starbursts powering the FIR emission in some hosts of radio-loud AGN have been found at low-to-intermediate redshifts (e.g. Dicken et al. 2010). In the high-z Universe, high levels of star formation in some radio-loud AGN have been estimated using several observational indicators. These include the usage of rest-frame UV spectroscopy to detect huge Lyα halos surrounding the AGN (e.g. Villar-Martín et al. 1999), submm photometry to probe the cool dust and molecular gas content of AGN hosts (e.g. Archibald et al. 2001; Reuland et al. 2004), and Spitzer MIR spectroscopy to detect strong PAH features (e.g. Rawlings et al. 2013). The latter, however, are seen only in rare cases because the AGN-powered hot/warm dust emission in powerful radio-loud AGN hosts usually outshines the PAH emission.
UV/visible data have been used to infer SFRs for several 3CR radio galaxies studied in this work (Chambers & Charlot 1990). These include 3C 065, 3C 068.2, 3C 266, 3C 267, 3C 324, 3C 356 and 3C 368. The ratio between the SFR obtained using the approach taken in this work and the UV/visible SFR ranges between 4 and 40, therefore we conclude that the star formation is often strongly obscured in the UV/visible. This comparison demonstrates that rest-frame FIR data are crucial in quantifying the dust-enshrouded star formation in the hosts of these sources, especially the ones hosting quasars because the emission from the accretion disk complicates the SFRs estimates from UV/visible data. Using Herschel data, Seymour et al. (2011) found mean SFRs for 1.2 <z< 3.0 radio-selected AGN to range between 80 and 581 M⊙ yr-1. Similarly, Drouart et al. (2014) studied a sample of ~70, 1 <z< 5 radio galaxies, estimating SFRs of a few hundred to a few thousand solar masses per year. While the authors suggest that the highest values reported in their study are likely overestimated and should be treated as upper limits, the overall idea that the hosts of high-z radio-loud AGN can be prodigious star-formers is consistent with our findings for the hosts of the powerful 3CR objects. A crucial point in these analyses is that the high star formation luminosities obtained are coeval with the growth of the SMBHs residing in the nuclei of the host galaxies. As such, these results argue for a scenario whereby on average the SMBH has not quenched the star formation in the host galaxy, which is at odds with results presented by Page et al. (2012). A series of coeval episodes of strong star formation and black hole activity may have formed the massive host galaxies and their massive black holes (see B12).
The SFRs estimated for the FIR-detected radio-loud AGN are comparable to those obtained for SMGs at similar redshifts (e.g. Magnelli et al. 2012). Other parameters, such as the temperatures and masses of the cold dust component and total stellar masses agree with each other, at least on average, as well (Santini et al. 2010; Michałowski et al. 2012; Swinbank et al. 2014). It is widely thought that high-z SMGs form stars in starburst events, induced as a result of a variety of different processes including mergers and tidal interactions. Radio-loud AGN are known to be at the centres of over-densities in the high-z Universe (e.g. Venemans et al. 2007; Wylezalek et al. 2013). Thus, the merger scenario appears to be an attractive way of producing at least some of the extremely high SFRs estimated in our study. A similar conclusion has been drawn in a study of a few high-z radio galaxies using both Herschel and CO observations (Ivison et al. 2012).
Jet-induced star formation, also known as positive feedback, is yet another possible way to trigger high SFRs (e.g. Dey et al. 1997; van Breugel et al. 1998) in hosts of radio-loud AGN. In this scenario, the outgoing radio jet shocks the surrounding interstellar material, which subsequently cools down to form new stars. Recently, based on UV-to-submm templates built with the evolutionary code PEGASE.3, Rocca-Volmerange et al. (2013) showed that the star formation timescales from stellar population synthesis agree well with the ages of the radio episodes for two high-z radio galaxies. Similar studies of larger samples are required to better understand the details of jet-induced star formation.
Despite evidence for strong star formation in the 3CR hosts detected in at least three Herschel bands, ~60% of 3CR sources are detected in fewer than three Herschel bands, arguing for significantly lower star formation activity in these hosts. While the upper limits in the SPIRE bands still allow energetically significant SFRs of up to 300 M⊙ yr-1 in some of these hosts, the overwhelming majority have SFRs of at most 100 M⊙ yr-1. This raises an important question: what leads to the significantly lower star formation activity in these hosts? If the star formation activity is indeed merger-induced, one possible answer to the above question is that occurrences of minor- and/or gas-poor mergers are likely to lead to relatively low levels of star formation activity. The relevance of the merger scenario in the context of the triggering of starbursts, but also of the AGN activity, has been discussed by Tadhunter et al. (2011). They find that the strongly starbursting radio galaxies in their intermediate-redshift sample have optical morphological features consistent with the idea that they are triggered in major mergers. Another possibility is that we are observing some hosts after the star formation has been quenched (e.g. Farrah et al. 2012). If the AGN activity is responsible for the quenching, then we argue that this negative feedback is not universal, even if it acts over a very short timescale. First, given the strong star formation in the 3CR hosts detected in at least three Herschel bands, it is unlikely that the quenching of star formation occurs before the radio-loud AGN phase. Second, quenching taking place during the radio-loud phase is not supported with the finding in Sect. 4.4 that the <2 μm rest-frame stacked SEDs of the two RG subsamples are similar. In particular, if star formation in the non-detected RGs is quenched, then they are expected to be brighter than the FIR-detected RGs because the star formation in the latter is heavily dust obscured. Third, because the radio-loud phase probably marks the end of the AGN phase, it is unlikely that the quenching occurs after the radio-loud phase. To conclude, while the hosts of the quasar-mode radio-loud AGN studied here may have a wide range of SFRs, it is unlikely that the triggering or quenching of their star formation activity is associated with a uniform scenario met in all objects.
5.2. RG and QSR unification in the FIR
Unification theories of radio-loud AGN (Barthel 1989; Antonucci 1993) ascribe observed differences in the properties of radio galaxies and quasars solely to orientation effects. Using Spitzer photometric observations of the sample of 3CR objects studied here, (Haas et al. 2008; see also the median SEDs from our current work) found the mean 1–10 μm rest-frame radio galaxy SED to be consistent with a sum of an underlying host and a heavily obscured quasar. Unification among the high-z 3CR objects was further corroborated with Spitzer spectroscopic (Leipski et al. 2010) and Chandra X-ray observations (Wilkes et al. 2013). Our results reveal that the optically thin (i.e. isotropic) FIR emission is similar for radio galaxies and quasars, thus in line with the predictions of radio-loud AGN unification by orientation.
5.3. AGN versus non-AGN host galaxies
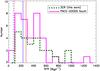 |
Fig. 8 Comparison of star formation rates of AGN and non-AGN host galaxies. Plotted are the objects detected in at least three Herschel bands (dashed green). A comparison sample of objects (solid magenta) is selected from some of the deepest Herschel data, from PACS-GOODS South field (Rodighiero et al. 2011). The vertical lines correspond to the average values of the FIR-detected (solid lines) and non-detected (dashed lines) stacked subsamples, discussed in Sect. 4.4. |
It is important to check how the SFRs obtained for the FIR-detected objects in this work compare to those for the non-AGN galaxy population. SFRs in star-forming galaxies are strongly correlated with both stellar mass and redshift (e.g. Elbaz et al. 2007), therefore, the comparison must be made with a sample having a comparable range of stellar mass and redshift. About a dozen 3CR radio galaxies studied in this work have stellar mass estimates primarily based on SED-fitting of visible/NIR (Best et al. 1998) or MIR broad-band photometry (Seymour et al. 2007; De Breuck et al. 2010). The estimated stellar masses range between 1.5 × 10¹¹ M⊙ and 6 × 10¹¹ M⊙, and are not expected to be a function of the redshift/luminosity of the sources (De Breuck et al. 2010). Measurements of stellar masses in high-z quasar hosts are problematic because the strong continuum emission from the accretion disk often outshines their host galaxies. However, assuming that unification of powerful radio galaxies and quasars holds, the masses of quasars and radio galaxies hosts are often taken to be (at least on average) similar (e.g. McLure et al. 2006). Thus, for the discussion below, we assume that the stellar masses of our 3CR hosts range between 1.5 × 10¹¹ M⊙ and 6 × 10¹¹ M⊙.
As a control sample of non-AGN galaxies, we selected 1.5 <z< 2.5 galaxies within the stellar mass range indicated above, whose star-forming properties were estimated from deep PACS data of the GOODS South field (cyan points in Fig. 1 from Rodighiero et al. 2011). The stellar masses of these galaxies were estimated from SED-fitting as explained by Rodighiero et al. (2010). While the majority of the selected galaxies lie on the main sequence of star-forming galaxies, a fraction are located above it, most likely characterized by the starbursting nature of the ongoing star formation (Rodighiero et al. 2011). Figure 8 shows the SFR histograms of the 3CRs and the selected control sample. It is clear that the 3CR FIR-detected objects have, on average, SFRs comparable to those of their equally massive non-AGN counterparts. The majority of FIR-detected objects are thus also located near the main sequence of star-forming galaxies, similarly to what has been found in deep Herschel/PACS studies of less powerful, X-ray selected, high-z AGN (Mullaney et al. 2012; Santini et al. 2012; Rosario et al. 2013). In comparison to the FIR-detected objects, the non-detected objects have similar stellar mass but significantly lower SFRs, placing them below the main sequence of star-forming galaxies. We cannot exclude the possibility that the star formation activity in some of these objects has been quenched. Better estimates of the stellar masses of our high-z 3CR sources will allow a more robust statistical study of their exact location with respect to the main sequence of star-forming galaxies.
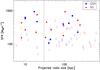 |
Fig. 9 Estimated star formation rate as a function of projected radio size (measured lobe to lobe) for the 3CR galaxies (red circles) and quasars (blue squares). The dashed line indicates the value taken to differentiate between subgalactic (<30 kpc) and supergalactic (>30 kpc) radio sources, respectively. Arrows indicate star formation rate upper limits for objects with fewer than three Herschel detections. |
5.4. Subgalactic versus supergalactic radio sources
The radio morphologies of radio-loud AGN present a unique opportunity to estimate the duration of the AGN episode by assuming a typical speed of radio jet expansion of 10%–20% of the speed of light. The projected radio sizes of our high-z 3CR sources, measured lobe-to-lobe, have been measured from high-resolution radio images. Based on their projected radio sizes, we divided the 3CR sources into two groups, subgalactic (<30 kpc) and supergalactic (>30 kpc) radio sources. The subgalactic sources, typically contained within their host galaxies, account for 25% of our high-z 3CR sample. Figure 9 shows the objects’ estimated SFRs as a function of their projected radio size. Both the subgalactic and supergalactic FIR-detected 3CR hosts have comparable SFRs. In contrast, the majority of the non-detected objects have larger, i.e. older radio sources. As such, the ratio of FIR-detected versus non-detected objects appears to be a function of projected radio size, changing from 1.3 for subgalactic to 0.5 for supergalactic sources.
There are at least two different effects contributing to the findings presented in Fig. 9. First, the finding that many quiescent galaxies turn up when the radio sources are large is consistent with the fact that star formation depends heavily on the availability of cold gas. Indeed, the process of exhausting the available fuel for star formation has timescales similar to the age of large radio sources. Second, our result that many small radio sources are hosted by strongly star-forming galaxies is consistent with the observational/theoretical finding that radio jets may induce bursts of star formation (positive feedback, e.g. Silk 2013) in the hosts of high-z (Dey et al. 1997; van Breugel et al. 1998) and low-z radio-loud AGN (Tadhunter et al. 2011; Dicken et al. 2012). Best et al. (1996) found that smaller radio sources show stronger alignment effect5 providing further support for the incidence of positive feedback in hosts of small radio sources. A step forward in probing the incidence of positive feedback within the hosts of 3CR sources may be achieved by correlating the ages of the young stellar components and those of the current radio episode, similarly to the study by Rocca-Volmerange et al. (2013). An issue which complicates the overall picture, however, is whether the link between the smaller radio sources and star formation activity is a consequence of an observational bias. Namely, as pointed out by Tadhunter et al. (2011), the interaction between the jet and the host ISM in subgalactic sources may boost the radio emission, leading to a preferential selection of such sources in flux-limited samples, like the 3CR studied here.
5.5. Model fit limitations
Our estimates of the cold dust temperature may suffer from a bias due to the known degeneracy between the cold dust temperature and the dust emissivity index, β: a lower fixed β value will lead to a higher dust temperature. Constraining the emissivity index within our sample is a difficult task because (1) the peak of the dust emission is not well isolated in the SED; and (2) only a few data points probe the Rayleigh-Jeans tail of the dust emission. Because of this, and to limit the number of free parameters throughout the fitting, we fixed the emissivity index to a value of 1.6. However, the detections in all Herschel bands, in addition to the availability of submm data, allow β to be constrained for a few selected objects. The β values for these five objects (flagged in Table 4) range from 1 to 2.3, with increased/decreased estimated cold dust temperatures for lower/higher β values, respectively. Nevertheless, the star formation luminosities, and consequently SFRs, remain the same (within 10%).
While we attribute the FIR emission to star formation on the scale of the host galaxy, we stress that the FIR emission considered is the excess emission after the AGN-powered torus emission (using the models of Hönig & Kishimoto 2010) has been accounted for. From our SEDs, we concluded that star formation is the dominant process yielding emission at rest-frame wavelengths longer than λ> 50 μm (see also Leipski et al. 2013). Nevertheless, should future AGN models demonstrate that the AGN-powered emission continues to dominate at rest-frame wavelengths longer than λ ~ 50 μm, then our SFR estimates are likely to be upper limits.
6. Conclusions
We present Herschel photometry of the complete sample of z> 1 3CR radio galaxies and quasars. The 3CR sample is a flux-limited sample, consisting of some of the most powerful radio-loud AGN accreting in quasar-mode. Combining the Herschel photometry with available Spitzer data, we performed a full IR SED analysis, separating the contribution from the AGN and from the star formation activity in the host galaxy. We summarize our findings below:
-
1.
About 40% of the studied objects have robust PACS and SPIRE detections, translating into ULIRG-like star formation luminosities, i.e. SFRs of order of hundreds of solar masses per year. Such prodigious levels of star formation have recently also been inferred for other high-z radio galaxies (e.g. Drouart et al. 2014). Merger induced and/or jet triggered star formation activity are both possible mechanisms leading to the SFRs obtained for these objects.
-
2.
The SFRs of the FIR-detected objects are comparable to those of mass-matched, non-AGN galaxies, selected from deep Herschel surveys. There is no clear evidence that the star formation has been quenched in the hosts of the FIR-detected objects.
-
3.
The total IR (1–1000 μm) emission from the high-z 3CR radio sources is predominantly powered by the AGN, despite the frequently strong starburst activity coeval with the AGN episode. Furthermore, no strong correlation between the AGN- and star formation powered IR luminosities is found.
-
4.
The median SEDs of the FIR-detected objects show that RGs and QSRs are quite different in the MIR, but remarkably similar in the FIR. Thus, while the MIR emission is anisotropic, the FIR emission is isotropic and optically thin. These findings are consistent with the orientation-based unification of radio-loud AGN.
-
5.
Splitting the sample into subgalactic (<30 kpc) and supergalactic (>30 kpc) radio sources, the fraction of Herschel detected objects is a function of the projected radio size of the sources. In particular, the hosts of subgalactic radio sources are more likely to be detected by Herschel, arguing for a possible link between radio size and star formation activity, i.e. jet-induced star formation (positive feedback), or for fading of star formation in mature AGN.
-
6.
Stacking of the Herschel non-detected objects reveals a class of MIR/FIR faint objects. While ongoing star formation episodes (at significantly lower levels than those discussed above) cannot be ruled out, star formation has largely ceased in the hosts of these objects. As such, the radio-selected, high-z 3CR hosts appear to be a heterogeneous mixture of MIR/FIR bright and faint objects.
Upcoming instruments with better sensitivity/resolution, such as ALMA, will likely help us pinpoint the exact location of the ongoing star formation in high-z galaxies. This will lead to a further understanding of the interplay between the AGN and star formation activity within high-z AGN hosts.
Online material
Summary of selected properties of the high-z 3CR sample studied in this work.
Herschel and Spitzer photometry of the 3CR objects studied in this work.
Physical parameters estimated from the SED fitting.
Appendix A: UV/visible SEDs of quasars
The emission from powerful quasars at UV/visible wavelengths comes predominantly from the hot accretion disk. In quasar SED fitting, this component is typically represented by a power-law (PL), extended to the NIR by introducing a PL index of − 2 (Fν ∝ ν2) (e.g. Leipski et al. 2013) In the current work, we do not fit the rest-frame UV/visible SEDs of quasars because it has a negligible influence on the FIR part of the SED. We demonstrate this using two objects that have good coverage in the UV/visible: 3C 454.0 and 3C 002.
Firstly, we consider 3C 454.0 (upper panels of Fig. A.1), for which we have SDSS photometry (ugriz) in addition to the Spitzer and Herschel photometry, and compare the results when we include/exclude the PL component. In a first attempt, we fit the data using a PL component in addition to the 1300 K blackbody, torus, and star-formation-heated cold dust components. Given the redshift of 3C 454.0, strong MgII emission at rest-frame ~0.3 μm, typical for optical spectra of quasars, significantly contributes to its broad-band i and z photometry. The SED fitting including the PL component was therefore performed using only the u, g, and r SDSS photometry. In a second attempt, we fit only data at rest-frame wavelengths longer than 2 μm, excluding the PL component from the fit. As seen in Fig. A.1, the best-fit SEDs longward of 2 μm rest-frame
wavelength are very similar for the two fitting approaches. The only difference is the flux normalization of the hot dust component, which turns out to be slightly lower when including the UV/visible part of the SED. Understandably, this is a result of the PL component contributing to the emission in the shorter Spitzer wavelengths. While the fitting procedures prefer different torus models, the luminosity of this component changes by less than 10%. Most importantly, the most relevant physical parameters for the current work, i.e. the SFR, and the temperature and mass of the cold dust component remain within 10%.
Secondly, we consider 3C 002 (lower panels of Fig. A.1), for which in addition to SDSS, Spitzer and Herschel photometry, we have photometry from 2MASS. We fit the full SED of this object, after discarding data points potentially contaminated by strong emission lines. Once again we reach the same results as in the case for 3C 454.0, thus we conclude that a detailed treatment of the emission in the UV/visible part of the quasars’ SEDs has a negligible effect on the results inferred from the IR part of the SED. Furthermore, many 3CR quasars lack good UV/visible/NIR photometric data, making the inclusion of the PL component to the fitting procedure impossible. Consequently, the results presented in our work were obtained using the best-fit SEDs without fitting a PL to the UV/visible part of the SEDs of quasars.
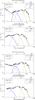 |
Fig. A.1 Spectral energy distributions of two quasars with good visible/UV detections. Left panels: include a power-law component (dash-dotted pink) representing the emission from the hot accretion disk. Right panels: exclude that component, and show the components considered when fitting the quasars in this work. Other individual components as described in Fig. 2. |
Appendix B: Comments on individual objects
3C 036 – This source requires an additional hot dust component to better fit the data. 3C 043 – There is a bright nearby object dominating the emission in the PACS 160 μm band. We report no measurement in this band. 3C 065 – This source requires an additional hot dust component to better fit the data. 3C 068.2 – IRS 16 μm data point is removed from the fitting procedure. 3C 119 – Diffuse emission present in the PACS 160 μm and SPIRE maps owing to the object’s low galactic latitude. This source requires an additional hot dust component to better fit the data. 3C 208.1 – This source requires an additional hot dust component to better fit the data. 3C 210 – Bright nearby object present in SPIRE bands. Deblending is not possible. We report no measurements in the SPIRE bands. Photometry in PACS 160 μm was performed with an aperture of 6″ radius. This source requires an additional hot dust component to better fit the data. IRAC 8 μm and IRS 16 μm data are not fitted well. 3C 222 – IRS 16 μm data point is removed from the fitting procedure. 3C 230 – The Spitzer photometry probably includes a star located very close to the radio galaxy. IRAC 3.6 μm, IRAC 4.5 μm,
and IRAC 5.8 μm data points are removed from the fitting procedure. 3C 252 – This source requires an additional hot dust component to better fit the data. 3C 255 – The IRAC points are not fitted well with the blackbody component representing emission from old stars in the host galaxy. 3C 257 – This source requires an additional hot dust component to better fit the data. 3C 267 – This source requires an additional hot dust component to better fit the data. 3C 305.1 – This source requires an additional hot dust component to better fit the data. IRAC 8 μm and IRS 16 μm data are not fitted well. 3C 318 – Bright nearby object present in the PACS and SPIRE bands. Deblending is not possible for SPIRE 350 μm and SPIRE 500 μm. We report no measurement in these two bands. 3C 324 – IRAC 8 μm and IRS 16 μm data are not fitted well. 3C 418 – The only flat-spectrum-core-dominated object within the high-z 3CR sample; completely synchrotron dominated. We do not include this source in the analysis. 3C 454.1 – Diffuse emission present in the SPIRE maps. 3C 469.1 – The PACS 160 μm flux density might be slightly contaminated by a nearby object. This source requires an additional hot dust component to better fit the data. IRAC 8 μm and IRS 16 μm data are not fitted well.
Appendix C: Best-fit SEDs of objects detected in at least three Herschel bands
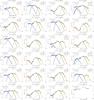 |
Fig. C.1 Spectral energy distributions of the 24 objects detected in at least three Herschel bands. Individual components as described in Fig. 2. 3C 418 was not included in the analysis, as discussed in Sect. 3.3. |
Appendix D: Best-fit SEDs of objects detected in fewer than three Herschel bands
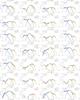 |
Fig. D.1 Spectral energy distributions of the objects detected in fewer than three Herschel bands. Individual components as described in Fig. 2. Red circles denote 3σ upper limits taken to be tentative detections when calculating upper limits of physical parameters, as explained in Sect. 3. |
 |
Fig. D.1 continued. |
Appendix E: Postage stamps
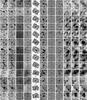 |
Fig. E.1 Postage stamps of the high-z 3CR objects studied in this work. From left to right: IRAC 3.6 μm, IRAC 4.5 μm, IRAC 5.8 μm, IRAC 8 μm, IRS 16 μm, MIPS 24 μm, PACS 70 μm, PACS 160 μm, SPIRE 250 μm, SPIRE 350 μm, and SPIRE 500 μm bands, respectively. Each image shown here has dimensions of 2 × 2 arcmin. The circle (10″ in radius) indicates the central position of the source. |
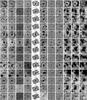 |
Fig. E.1 continued. |
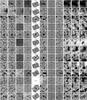 |
Fig. E.1 continued. |
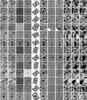 |
Fig. E.1 continued. |
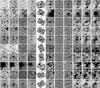 |
Fig. E.1 continued. |
The QSRs median SED is given only for rest-frame wavelengths longer than 2 μm because the emission at wavelengths shorter than 2 μm is dominated by the hot accretion disk, which was not included in our SED fitting (as explained in Appendix A).
The alignment effect is the co-spatial extent of radio and UV/visible/NIR emission in radio-loud AGN, partly due to the interaction between the jet and the interstellar matter of the host galaxy (McCarthy 1993; Miley & De Breuck 2008).
Acknowledgments
The authors acknowledge the expert referee for useful comments which improved the paper, and thank Giulia Rodighiero for kindly providing the PEP data from the deep GOODS South field. P.P. acknowledges the Nederlandse Organisatie voor Wetenschappelijk Onderzoek (NWO) for a Ph.D. fellowship. M.H. and C.W. are supported by the Akademie der Wissenschaften und der Künste Nordrhein-Westfalen and by Deutsches Zentrum für Luft-und Raumfahrt (DLR). The Herschel spacecraft was designed, built, tested, and launched under a contract to ESA managed by the Herschel/Planck Project team by an industrial consortium under the overall responsibility of the prime contractor Thales Alenia Space (Cannes), and including Astrium (Friedrichshafen) responsible for the payload module and for system testing at spacecraft level, Thales Alenia Space (Turin) responsible for the service module, and Astrium (Toulouse) responsible for the telescope, with in excess of a hundred subcontractors. PACS has been developed by a consortium of institutes led by MPE (Germany) and including UVIE (Austria); KU Leuven, CSL, IMEC (Belgium); CEA, LAM (France); MPIA (Germany); INAF-IFSI/OAA/OAP/OAT, LENS, SISSA (Italy); IAC (Spain). This development has been supported by the funding agencies BMVIT (Austria), ESA-PRODEX (Belgium), CEA/CNES (France), DLR (Germany), ASI/INAF (Italy), and CICYT/MCYT (Spain). SPIRE has been developed by a consortium of institutes led by Cardiff University (UK) and including Univ. Lethbridge (Canada); NAOC (China); CEA, LAM (France); IFSI, Univ. Padua (Italy); IAC (Spain); Stockholm Observatory (Sweden); Imperial College London, RAL, UCL-MSSL, UKATC, Univ. Sussex (UK); and Caltech, JPL, NHSC, Univ. Colorado (USA). This development has been supported by national funding agencies: CSA (Canada); NAOC (China); CEA, CNES, CNRS (France); ASI (Italy); MCINN (Spain); SNSB (Sweden); STFC, UKSA (UK); and NASA (USA). HIPE is a joint development by the Herschel Science Ground Segment Consortium, consisting of ESA, the NASA Herschel Science Center, and the HIFI, PACS and SPIRE consortia. This work is partly based on observations made with the Spitzer Space Telescope, which is operated by the Jet Propulsion Laboratory, California Institute of Technology under a contract with NASA. This research has made use of the NASA/IPAC Extragalactic Database (NED) which is operated by the Jet Propulsion Laboratory, California Institute of Technology, under contract with the National Aeronautics and Space Administration. This research made use of APLpy, an open-source plotting package for Python hosted at http://aplpy.github.com
References
- Alexander, D. M., Brandt, W. N., Smail, I., et al. 2008, AJ, 135, 1968 [NASA ADS] [CrossRef] [Google Scholar]
- Antonucci, R. 1993, ARA&A, 31, 473 [Google Scholar]
- Archibald, E. N., Dunlop, J. S., Hughes, D. H., et al. 2001, MNRAS, 323, 417 [NASA ADS] [CrossRef] [Google Scholar]
- Balog, Z., Müller, T., Nielbock, M., et al. 2013, Exp. Astron., 38 [Google Scholar]
- Barthel, P. D. 1989, ApJ, 336, 606 [Google Scholar]
- Barthel, P., Haas, M., Leipski, C., & Wilkes, B. 2012, ApJ, 757, L26 (B12) [NASA ADS] [CrossRef] [Google Scholar]
- Beelen, A., Cox, P., Benford, D. J., et al. 2006, ApJ, 642, 694 [NASA ADS] [CrossRef] [Google Scholar]
- Bendo, G. J., Griffin, M. J., Bock, J. J., et al. 2013, MNRAS, 433, 3062 [NASA ADS] [CrossRef] [Google Scholar]
- Benford, D. J., Cox, P., Omont, A., Phillips, T. G., & McMahon, R. G. 1999, ApJ, 518, L65 [NASA ADS] [CrossRef] [Google Scholar]
- Best, P. N., & Heckman, T. M. 2012, MNRAS, 421, 1569 [NASA ADS] [CrossRef] [Google Scholar]
- Best, P. N., Longair, M. S., & Rottgering, H. J. A. 1996, MNRAS, 280, L9 [NASA ADS] [CrossRef] [Google Scholar]
- Best, P. N., Longair, M. S., & Roettgering, H. J. A. 1998, MNRAS, 295, 549 [NASA ADS] [CrossRef] [Google Scholar]
- Chambers, K. C., & Charlot, S. 1990, ApJ, 348, L1 [NASA ADS] [CrossRef] [Google Scholar]
- Cleary, K., Lawrence, C. R., Marshall, J. A., Hao, L., & Meier, D. 2007, ApJ, 660, 117 [NASA ADS] [CrossRef] [Google Scholar]
- Croton, D. J., Springel, V., White, S. D. M., et al. 2006, MNRAS, 365, 11 [NASA ADS] [CrossRef] [Google Scholar]
- De Breuck, C., Seymour, N., Stern, D., et al. 2010, ApJ, 725, 36 [NASA ADS] [CrossRef] [Google Scholar]
- Dey, A., van Breugel, W., Vacca, W. D., & Antonucci, R. 1997, ApJ, 490, 698 [NASA ADS] [CrossRef] [Google Scholar]
- Dicken, D., Tadhunter, C., Axon, D., et al. 2010, ApJ, 722, 1333 [NASA ADS] [CrossRef] [Google Scholar]
- Dicken, D., Tadhunter, C., Axon, D., et al. 2012, ApJ, 745, 172 [NASA ADS] [CrossRef] [Google Scholar]
- Draine, B. T. 2003, ARA&A, 41, 241 [NASA ADS] [CrossRef] [Google Scholar]
- Drouart, G., De Breuck, C., Vernet, J., et al. 2014, A&A, 566, A53 [NASA ADS] [CrossRef] [EDP Sciences] [Google Scholar]
- Elbaz, D., Daddi, E., Le Borgne, D., et al. 2007, A&A, 468, 33 [NASA ADS] [CrossRef] [EDP Sciences] [Google Scholar]
- Elbaz, D., Dickinson, M., Hwang, H. S., et al. 2011, A&A, 533, A119 [NASA ADS] [CrossRef] [EDP Sciences] [Google Scholar]
- Fanaroff, B. L., & Riley, J. M. 1974, MNRAS, 167, 31P [Google Scholar]
- Farrah, D., Urrutia, T., Lacy, M., et al. 2012, ApJ, 745, 178 [NASA ADS] [CrossRef] [Google Scholar]
- Fazio, G. G., Hora, J. L., Allen, L. E., et al. 2004, ApJS, 154, 10 [NASA ADS] [CrossRef] [Google Scholar]
- Griffin, M. J., Abergel, A., Abreu, A., et al. 2010, A&A, 518, L3 [Google Scholar]
- Gültekin, K., Richstone, D. O., Gebhardt, K., et al. 2009, ApJ, 698, 198 [NASA ADS] [CrossRef] [Google Scholar]
- Haas, M., Müller, S. A. H., Bertoldi, F., et al. 2004, A&A, 424, 531 [NASA ADS] [CrossRef] [EDP Sciences] [Google Scholar]
- Haas, M., Chini, R., Müller, S. A. H., Bertoldi, F., & Albrecht, M. 2006, A&A, 445, 115 [NASA ADS] [CrossRef] [EDP Sciences] [Google Scholar]
- Haas, M., Willner, S. P., Heymann, F., et al. 2008, ApJ, 688, 122 [NASA ADS] [CrossRef] [Google Scholar]
- Harrison, C. M., Alexander, D. M., Mullaney, J. R., et al. 2012, ApJ, 760, L15 [NASA ADS] [CrossRef] [Google Scholar]
- Heckman, T. M., Chambers, K. C., & Postman, M. 1992, ApJ, 391, 39 [NASA ADS] [CrossRef] [Google Scholar]
- Hes, R., Barthel, P. D., & Hoekstra, H. 1995, A&A, 303, 8 [NASA ADS] [Google Scholar]
- Hopkins, A. M., & Beacom, J. F. 2006, ApJ, 651, 142 [NASA ADS] [CrossRef] [MathSciNet] [Google Scholar]
- Hopkins, P. F., Cox, T. J., Kereš, D., & Hernquist, L. 2008, ApJS, 175, 390 [NASA ADS] [CrossRef] [MathSciNet] [Google Scholar]
- Houck, J. R., Roellig, T. L., van Cleve, J., et al. 2004, ApJS, 154, 18 [NASA ADS] [CrossRef] [Google Scholar]
- Hönig, S. F., & Kishimoto, M. 2010, A&A, 523, A27 [NASA ADS] [CrossRef] [EDP Sciences] [Google Scholar]
- Hönig, S. F., Beckert, T., Ohnaka, K., & Weigelt, G. 2006, A&A, 452, 459 [NASA ADS] [CrossRef] [EDP Sciences] [Google Scholar]
- Ivison, R. J., Smail, I., Amblard, A., et al. 2012, MNRAS, 425, 1320 [NASA ADS] [CrossRef] [Google Scholar]
- Kartaltepe, J. S., Dickinson, M., Alexander, D. M., et al. 2012, ApJ, 757, 23 [CrossRef] [Google Scholar]
- Kennicutt, R. C., Jr. 1998, ARA&A, 36, 189 [Google Scholar]
- Kirkpatrick, A., Pope, A., Alexander, D. M., et al. 2012, ApJ, 759, 139 [NASA ADS] [CrossRef] [Google Scholar]
- Kuraszkiewicz, J. K., Wilkes, B. J., Hooper, E. J., et al. 2003, ApJ, 590, 128 [NASA ADS] [CrossRef] [Google Scholar]
- Leipski, C., Haas, M., Willner, S. P., et al. 2010, ApJ, 717, 766 [NASA ADS] [CrossRef] [Google Scholar]
- Leipski, C., Meisenheimer, K., Walter, F., et al. 2013, ApJ, 772, 103 [NASA ADS] [CrossRef] [Google Scholar]
- Leipski, C., Meisenheimer, K., Walter, F., et al. 2014, ApJ, 785, 154 [NASA ADS] [CrossRef] [Google Scholar]
- Lutz, D. 2014, ARA&A, 52, 373 [NASA ADS] [CrossRef] [Google Scholar]
- Lutz, D., Poglitsch, A., Altieri, B., et al. 2011, A&A, 532, A90 [NASA ADS] [CrossRef] [EDP Sciences] [Google Scholar]
- Magnelli, B., Lutz, D., Santini, P., et al. 2012, A&A, 539, A155 [NASA ADS] [CrossRef] [EDP Sciences] [Google Scholar]
- Magorrian, J., Tremaine, S., Richstone, D., et al. 1998, AJ, 115, 2285 [NASA ADS] [CrossRef] [Google Scholar]
- Markwardt, C. B. 2009, Astronomical Data Analysis Software and Systems XVIII, 411, 251 [NASA ADS] [Google Scholar]
- McCarthy, P. J. 1993, ARA&A, 31, 639 [NASA ADS] [CrossRef] [Google Scholar]
- McLure, R. J., Jarvis, M. J., Targett, T. A., Dunlop, J. S., & Best, P. N. 2006, MNRAS, 368, 1395 [NASA ADS] [CrossRef] [Google Scholar]
- Meisenheimer, K., Haas, M., Müller, S. A. H., et al. 2001, A&A, 372, 719 [NASA ADS] [CrossRef] [EDP Sciences] [Google Scholar]
- Michałowski, M. J., Dunlop, J. S., Cirasuolo, M., et al. 2012, A&A, 541, A85 [NASA ADS] [CrossRef] [EDP Sciences] [Google Scholar]
- Miley, G., & De Breuck, C. 2008, A&ARv, 15, 67 [NASA ADS] [CrossRef] [Google Scholar]
- Mor, R., & Netzer, H. 2012, MNRAS, 420, 526 [NASA ADS] [CrossRef] [Google Scholar]
- Mullaney, J. R., Pannella, M., Daddi, E., et al. 2012, MNRAS, 419, 95 [NASA ADS] [CrossRef] [Google Scholar]
- Nenkova, M., Ivezić, Ž., & Elitzur, M. 2002, ApJ, 570, L9 [NASA ADS] [CrossRef] [Google Scholar]
- Netzer, H., Lutz, D., Schweitzer, M., et al. 2007, ApJ, 666, 806 [NASA ADS] [CrossRef] [Google Scholar]
- Nguyen, H. T., Schulz, B., Levenson, L., et al. 2010, A&A, 518, L5 [NASA ADS] [CrossRef] [EDP Sciences] [Google Scholar]
- O’Dea, C. P. 1998, PASP, 110, 493 [NASA ADS] [CrossRef] [Google Scholar]
- Ogle, P., Whysong, D., & Antonucci, R. 2006, ApJ, 647, 161 [NASA ADS] [CrossRef] [Google Scholar]
- Ott, S. 2010, Astronomical Data Analysis Software and Systems XIX, 434, 139 [NASA ADS] [Google Scholar]
- Page, M. J., Symeonidis, M., Vieira, J. D., et al. 2012, Nature, 485, 213 [NASA ADS] [CrossRef] [Google Scholar]
- Pascale, E., Auld, R., Dariush, A., et al. 2011, MNRAS, 415, 911 [NASA ADS] [CrossRef] [Google Scholar]
- Pilbratt, G. L., Riedinger, J. R., Passvogel, T., et al. 2010, A&A, 518, L1 [CrossRef] [EDP Sciences] [Google Scholar]
- Poglitsch, A., Waelkens, C., Geis, N., et al. 2010, A&A, 518, L2 [NASA ADS] [CrossRef] [EDP Sciences] [Google Scholar]
- Popesso, P., Magnelli, B., Buttiglione, S., et al. 2012 [arXiv:1211.4257] [Google Scholar]
- Ramos Almeida, C., Levenson, N. A., Rodríguez Espinosa, J. M., et al. 2009, ApJ, 702, 1127 [NASA ADS] [CrossRef] [Google Scholar]
- Rawlings, J. I., Seymour, N., Page, M. J., et al. 2013, MNRAS, 429, 744 [NASA ADS] [CrossRef] [Google Scholar]
- Reuland, M., Röttgering, H., van Breugel, W., & De Breuck, C. 2004, MNRAS, 353, 377 [NASA ADS] [CrossRef] [Google Scholar]
- Rieke, G. H., Young, E. T., Engelbracht, C. W., et al. 2004, ApJS, 154, 25 [NASA ADS] [CrossRef] [Google Scholar]
- Rocca-Volmerange, B., Drouart, G., De Breuck, C., et al. 2013, MNRAS, 429, 2780 [NASA ADS] [CrossRef] [Google Scholar]
- Rodighiero, G., Cimatti, A., Gruppioni, C., et al. 2010, A&A, 518, L25 [NASA ADS] [CrossRef] [EDP Sciences] [Google Scholar]
- Rodighiero, G., Daddi, E., Baronchelli, I., et al. 2011, ApJ, 739, L40 [NASA ADS] [CrossRef] [Google Scholar]
- Rosario, D. J., Santini, P., Lutz, D., et al. 2012, A&A, 545, A45 [NASA ADS] [CrossRef] [EDP Sciences] [Google Scholar]
- Rosario, D. J., Santini, P., Lutz, D., et al. 2013, ApJ, 771, 63 [NASA ADS] [CrossRef] [Google Scholar]
- Rowan-Robinson, M. 1995, MNRAS, 272, 737 [NASA ADS] [Google Scholar]
- Salpeter, E. E. 1955, ApJ, 121, 161 [Google Scholar]
- Santini, P., Maiolino, R., Magnelli, B., et al. 2010, A&A, 518, L154 [NASA ADS] [CrossRef] [EDP Sciences] [Google Scholar]
- Santini, P., Rosario, D. J., Shao, L., et al. 2012, A&A, 540, A109 [NASA ADS] [CrossRef] [EDP Sciences] [Google Scholar]
- Savage, R. S., & Oliver, S. 2007, ApJ, 661, 1339 [NASA ADS] [CrossRef] [Google Scholar]
- Schartmann, M., Meisenheimer, K., Camenzind, M., et al. 2008, A&A, 482, 67 [NASA ADS] [CrossRef] [EDP Sciences] [Google Scholar]
- Schweitzer, M., Lutz, D., Sturm, E., et al. 2006, ApJ, 649, 79 [NASA ADS] [CrossRef] [Google Scholar]
- Seymour, N., Stern, D., De Breuck, C., et al. 2007, ApJS, 171, 353 [NASA ADS] [CrossRef] [Google Scholar]
- Seymour, N., Symeonidis, M., Page, M. J., et al. 2011, MNRAS, 413, 1777 [NASA ADS] [CrossRef] [Google Scholar]
- Seymour, N., Altieri, B., De Breuck, C., et al. 2012, ApJ, 755, 146 [NASA ADS] [CrossRef] [Google Scholar]
- Shao, L., Lutz, D., Nordon, R., et al. 2010, A&A, 518, L26 [NASA ADS] [CrossRef] [EDP Sciences] [Google Scholar]
- Siebenmorgen, R., Freudling, W., Krügel, E., & Haas, M. 2004, A&A, 421, 129 [NASA ADS] [CrossRef] [EDP Sciences] [Google Scholar]
- Silk, J. 2013, ApJ, 772, 112 [NASA ADS] [CrossRef] [Google Scholar]
- Spinrad, H., Marr, J., Aguilar, L., & Djorgovski, S. 1985, PASP, 97, 932 [NASA ADS] [CrossRef] [Google Scholar]
- Swinbank, A. M., Simpson, J. M., Smail, I., et al. 2014, MNRAS, 438, 1267 [Google Scholar]
- Tadhunter, C., Holt, J., González Delgado, R., et al. 2011, MNRAS, 412, 960 [NASA ADS] [Google Scholar]
- Tadhunter, C., Dicken, D., Morganti, R., et al. 2014, MNRAS, 445, L51 [NASA ADS] [CrossRef] [Google Scholar]
- Tremaine, S., Gebhardt, K., Bender, R., et al. 2002, ApJ, 574, 740 [NASA ADS] [CrossRef] [Google Scholar]
- Urry, C. M., & Padovani, P. 1995, PASP, 107, 803 [NASA ADS] [CrossRef] [Google Scholar]
- van Bemmel, I. M., Barthel, P. D., & Yun, M. S. 1998, A&A, 334, 799 [Google Scholar]
- van Breugel, W. J. M., Stanford, S. A., Spinrad, H., Stern, D., & Graham, J. R. 1998, ApJ, 502, 614 [NASA ADS] [CrossRef] [Google Scholar]
- Venemans, B. P., Röttgering, H. J. A., Miley, G. K., et al. 2007, A&A, 461, 823 [NASA ADS] [CrossRef] [EDP Sciences] [Google Scholar]
- Villar-Martín, M., Fosbury, R. A. E., Binette, L., Tadhunter, C. N., & Rocca-Volmerange, B. 1999, A&A, 351, 47 [NASA ADS] [Google Scholar]
- Werner, M. W., Roellig, T. L., Low, F. J., et al. 2004, ApJS, 154, 1 [NASA ADS] [CrossRef] [Google Scholar]
- Wilkes, B. J., Kuraszkiewicz, J., Haas, M., et al. 2013, ApJ, 773, 15 [NASA ADS] [CrossRef] [Google Scholar]
- Willott, C. J., Rawlings, S., Archibald, E. N., & Dunlop, J. S. 2002, MNRAS, 331, 435 [NASA ADS] [CrossRef] [Google Scholar]
- Wylezalek, D., Galametz, A., Stern, D., et al. 2013, ApJ, 769, 79 [NASA ADS] [CrossRef] [Google Scholar]
All Tables
All Figures
|
Fig. 1 Observed radio (178 MHz) luminosity as a function of redshift for the 3CR sample considered in this work. Circles (red) indicate radio galaxies, and squares (blue) indicate quasars. The plus symbols mark the objects detected in at least three Herschel bands (typically the two PACS and the SPIRE 250 μm bands). |
| In the text | |
|
Fig. 2 IR spectral energy distributions (SEDs, solid black) for two representative objects from this work. Open circles show the photometric data. Error bars correspond to 1σ photometric uncertainties. Arrows indicate 3σ upper limits. Left panel: 3C 454.1, a radio galaxy at z = 1.84. The three components used to fit the SEDs of radio galaxies account for emission from host galaxy (old) stars (dash-dotted red), from an AGN-heated torus (dotted green), and from dust heated by star formation (dashed yellow). Right panel: 3C 205, a quasar at z = 1.53. The multi-component approach used to fit quasars accounts for emission from hot (1300 K) dust (long-dashed blue), from the AGN-heated torus (dotted green) and from the star formation heated dust (dashed yellow). |
| In the text | |
|
Fig. 3 Distributions of individual physical parameters obtained from the SED fits, for radio galaxies (red) and quasars (blue). The values plotted are those for the objects detected in at least three Herschel bands. Upper left panel: temperature of the cold dust component emitting in the FIR, Tdust. Upper right panel: mass of the FIR emitting cold dust component, Mdust. Lower left panel: AGN-powered IR luminosity, LAGN. Lower right panel: star-formation-powered IR luminosity, LSF. The vertical lines in the lower panels correspond to the average values of the FIR-detected (solid lines) and non-detected (dashed lines) stacked subsamples discussed in Sect. 4.4. |
| In the text | |
|
Fig. 4 IR emission from star-formation-heated cold dust, LSF, versus IR emission from AGN-powered dust, LAGN, for radio galaxies (filled red circles) and quasars (filled blue squares). Upper limits have been estimated as explained in the text. The large empty symbols correspond to the subsamples of FIR-detected RGs (circle) and QSRs (square), and non-detected RGs (triangle) and QSRs (diamond) discussed in Sect. 4.4. The dashed line marks LSF = LAGN. |
| In the text | |
|
Fig. 5 Median spectral energy distributions (SEDs) for the radio galaxies (dashed red) and quasars (dotted blue) detected in at least three Herschel bands, and for z ~ 2 star-forming galaxies (solid yellow) from Kirkpatrick et al. (2012). Shades areas, red for radio galaxies and blue for quasars, correspond to the associated 16th–84th percentile ranges. |
| In the text | |
|
Fig. 6 Stacked images in all Herschel bands, for the four subsamples discussed here. From left to right: PACS 70 μm, PACS 160 μm, SPIRE 250 μm, SPIRE 350 μm, and SPIRE 500 μm bands, respectively. From top to bottom: FIR-detected radio galaxies, non-detected radio galaxies, FIR-detected quasars, and non-detected quasars. Each stacked image shown here has dimensions of 2 × 2 arcmin and is centred on the known radio positions of the objects entering the stack. |
| In the text | |
|
Fig. 7 Spectral energy distributions of stacked subsamples selected from the hosts of the 3CR sources studies here. The four subsamples presented are: FIR-detected radio galaxies (red circles), non-detected radio galaxies (red triangles), FIR-detected quasars (blue squares), and non-detected quasars (blue diamonds). Arrows mark 3σ upper limits as explained in the text. |
| In the text | |
|
Fig. 8 Comparison of star formation rates of AGN and non-AGN host galaxies. Plotted are the objects detected in at least three Herschel bands (dashed green). A comparison sample of objects (solid magenta) is selected from some of the deepest Herschel data, from PACS-GOODS South field (Rodighiero et al. 2011). The vertical lines correspond to the average values of the FIR-detected (solid lines) and non-detected (dashed lines) stacked subsamples, discussed in Sect. 4.4. |
| In the text | |
|
Fig. 9 Estimated star formation rate as a function of projected radio size (measured lobe to lobe) for the 3CR galaxies (red circles) and quasars (blue squares). The dashed line indicates the value taken to differentiate between subgalactic (<30 kpc) and supergalactic (>30 kpc) radio sources, respectively. Arrows indicate star formation rate upper limits for objects with fewer than three Herschel detections. |
| In the text | |
|
Fig. A.1 Spectral energy distributions of two quasars with good visible/UV detections. Left panels: include a power-law component (dash-dotted pink) representing the emission from the hot accretion disk. Right panels: exclude that component, and show the components considered when fitting the quasars in this work. Other individual components as described in Fig. 2. |
| In the text | |
|
Fig. C.1 Spectral energy distributions of the 24 objects detected in at least three Herschel bands. Individual components as described in Fig. 2. 3C 418 was not included in the analysis, as discussed in Sect. 3.3. |
| In the text | |
|
Fig. D.1 Spectral energy distributions of the objects detected in fewer than three Herschel bands. Individual components as described in Fig. 2. Red circles denote 3σ upper limits taken to be tentative detections when calculating upper limits of physical parameters, as explained in Sect. 3. |
| In the text | |
|
Fig. D.1 continued. |
| In the text | |
|
Fig. E.1 Postage stamps of the high-z 3CR objects studied in this work. From left to right: IRAC 3.6 μm, IRAC 4.5 μm, IRAC 5.8 μm, IRAC 8 μm, IRS 16 μm, MIPS 24 μm, PACS 70 μm, PACS 160 μm, SPIRE 250 μm, SPIRE 350 μm, and SPIRE 500 μm bands, respectively. Each image shown here has dimensions of 2 × 2 arcmin. The circle (10″ in radius) indicates the central position of the source. |
| In the text | |
|
Fig. E.1 continued. |
| In the text | |
|
Fig. E.1 continued. |
| In the text | |
|
Fig. E.1 continued. |
| In the text | |
|
Fig. E.1 continued. |
| In the text | |
Current usage metrics show cumulative count of Article Views (full-text article views including HTML views, PDF and ePub downloads, according to the available data) and Abstracts Views on Vision4Press platform.
Data correspond to usage on the plateform after 2015. The current usage metrics is available 48-96 hours after online publication and is updated daily on week days.
Initial download of the metrics may take a while.