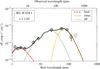
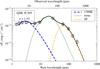
Fig. 2

IR spectral energy distributions (SEDs, solid black) for two representative objects from this work. Open circles show the photometric data. Error bars correspond to 1σ photometric uncertainties. Arrows indicate 3σ upper limits. Left panel: 3C 454.1, a radio galaxy at z = 1.84. The three components used to fit the SEDs of radio galaxies account for emission from host galaxy (old) stars (dash-dotted red), from an AGN-heated torus (dotted green), and from dust heated by star formation (dashed yellow). Right panel: 3C 205, a quasar at z = 1.53. The multi-component approach used to fit quasars accounts for emission from hot (1300 K) dust (long-dashed blue), from the AGN-heated torus (dotted green) and from the star formation heated dust (dashed yellow).
Current usage metrics show cumulative count of Article Views (full-text article views including HTML views, PDF and ePub downloads, according to the available data) and Abstracts Views on Vision4Press platform.
Data correspond to usage on the plateform after 2015. The current usage metrics is available 48-96 hours after online publication and is updated daily on week days.
Initial download of the metrics may take a while.