Fig. 3
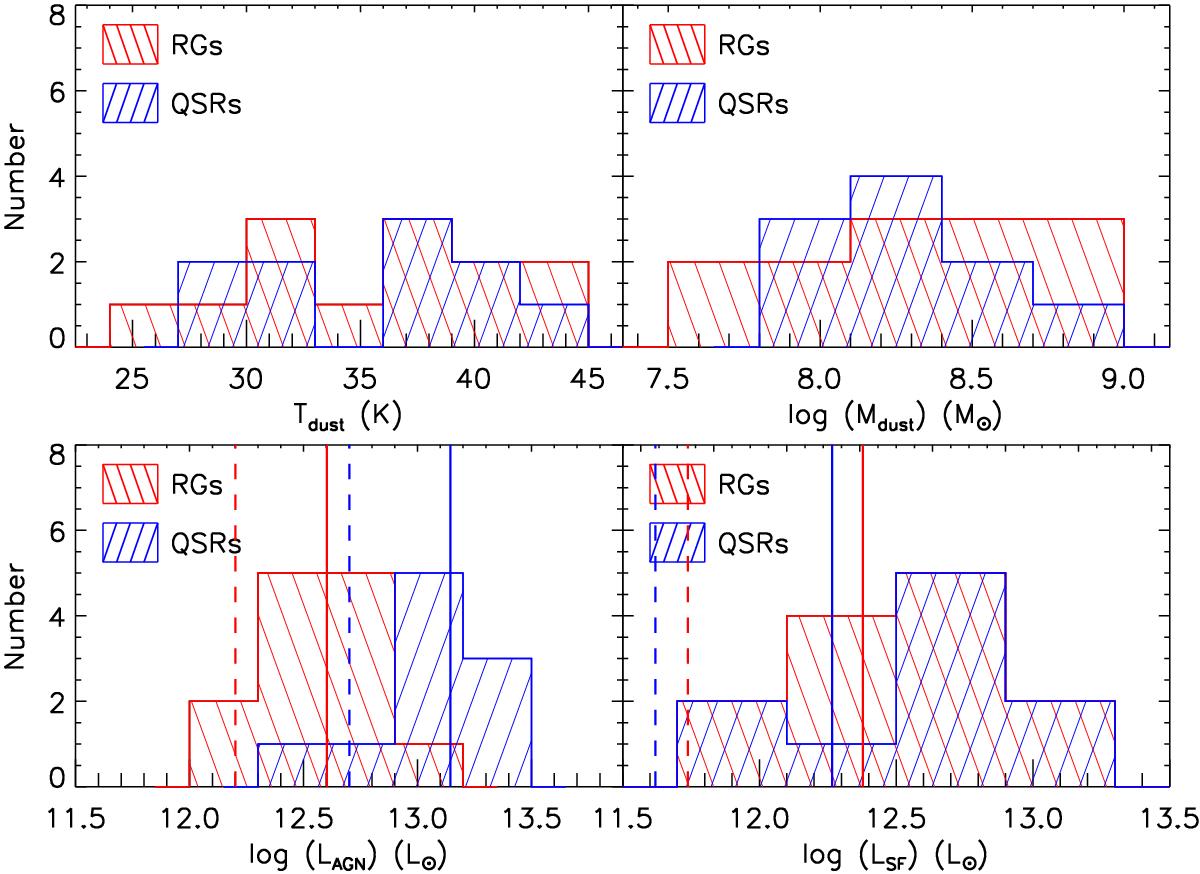
Distributions of individual physical parameters obtained from the SED fits, for radio galaxies (red) and quasars (blue). The values plotted are those for the objects detected in at least three Herschel bands. Upper left panel: temperature of the cold dust component emitting in the FIR, Tdust. Upper right panel: mass of the FIR emitting cold dust component, Mdust. Lower left panel: AGN-powered IR luminosity, LAGN. Lower right panel: star-formation-powered IR luminosity, LSF. The vertical lines in the lower panels correspond to the average values of the FIR-detected (solid lines) and non-detected (dashed lines) stacked subsamples discussed in Sect. 4.4.
Current usage metrics show cumulative count of Article Views (full-text article views including HTML views, PDF and ePub downloads, according to the available data) and Abstracts Views on Vision4Press platform.
Data correspond to usage on the plateform after 2015. The current usage metrics is available 48-96 hours after online publication and is updated daily on week days.
Initial download of the metrics may take a while.