Fig. 10
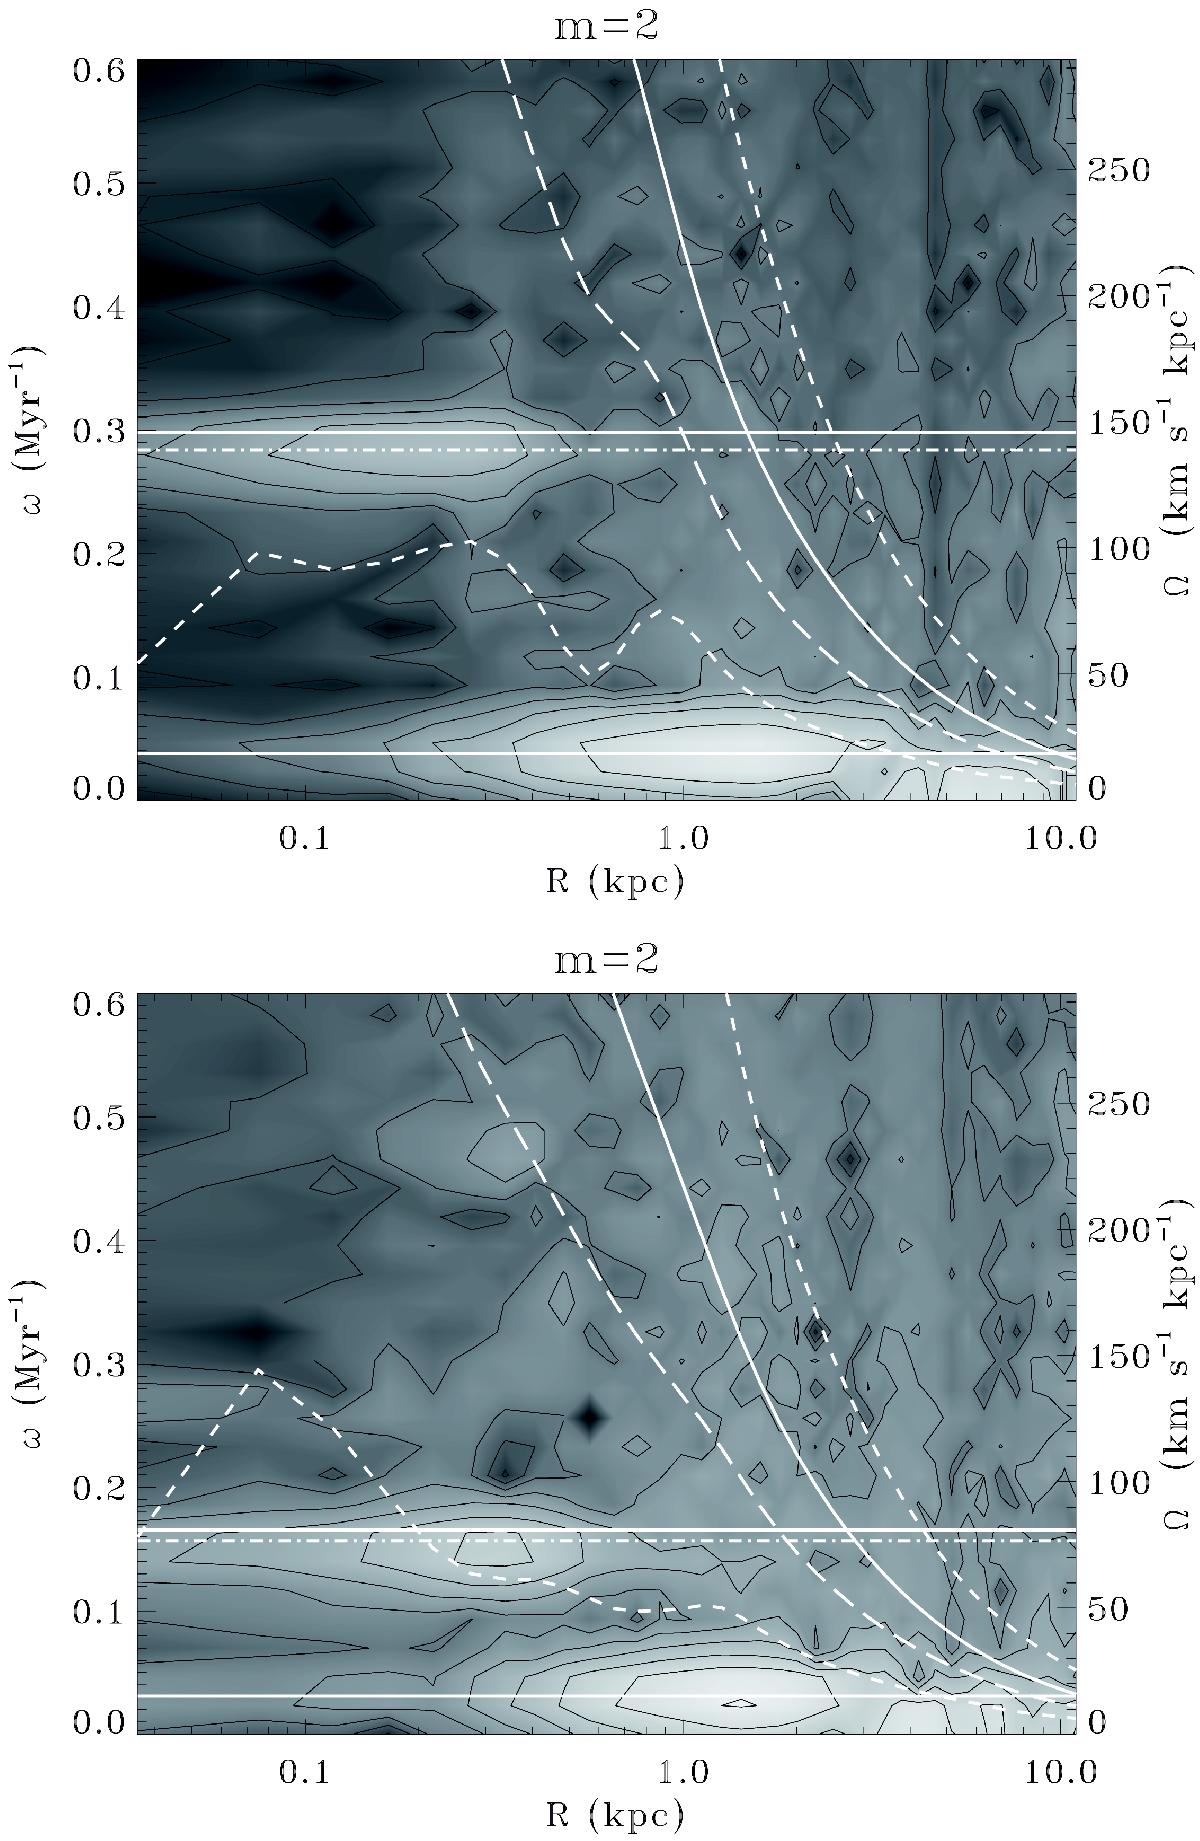
m = 2 power spectra for SimL in log scale. The time window spans 269 Myr centred at t = 3.3 and t = 7.5 Gyr. The left vertical scale gives values of ω, the wave frequency in Myr-1, whereas the right vertical scale is for the pattern speed Ω = ω/2 in kms-1 kpc-1. The horizontal white lines represent Ωs and Ωp, respectively, at the beginning of the time window (full line) and the end (dot-dashed one). Ωs decreases from 146 to 139 at t = 3.3 Gyr and from 81 to 71 kms-1 kpc-1 at t = 7.5 Gyr, whereas Ωp decreases by less than 1 kms-1 kpc-1 so that the two lines cannot be distinguished. The averaged curves 2Ω − κ (which allows the ILR to be identified) and 2Ω + κ (for the OLR) are drawn as white short dashed lines, 2Ω − κ/2 (for the UHR) as long dashed line, and 2Ω as a solid line (for the CR). A logarithmic scale has been chosen for the radius to emphasize the central kpc.
Current usage metrics show cumulative count of Article Views (full-text article views including HTML views, PDF and ePub downloads, according to the available data) and Abstracts Views on Vision4Press platform.
Data correspond to usage on the plateform after 2015. The current usage metrics is available 48-96 hours after online publication and is updated daily on week days.
Initial download of the metrics may take a while.