| Issue |
A&A
Volume 575, March 2015
|
|
|---|---|---|
| Article Number | A65 | |
| Number of page(s) | 8 | |
| Section | Astrophysical processes | |
| DOI | https://doi.org/10.1051/0004-6361/201424910 | |
| Published online | 24 February 2015 | |
The intermediate polar GK Persei: An unstable relation of the X-ray and the optical intensities in a series of outbursts⋆
1
Astronomical Institute, The Czech Academy of Sciences,
25165
Ondřejov,
Czech Republic
e-mail:
simon@asu.cas.cz
2 Czech Technical University in Prague, Faculty of Electrical
Engineering, Prague, Czech Republic
Received: 3 September 2014
Accepted: 19 December 2014
Context. GK Per is an intermediate polar that has been displaying dwarf nova outbursts since the middle of the twentieth century.
Aims. I analyzed a series of such outbursts in the optical and X-ray bands. I pay attention to the relation of intensities of the optical and X-ray emissions, and its reproducibility in a series of these consecutive outbursts.
Methods. This analysis uses the data from the BAT/Swift, ASM/RXTE, AAVSO, and AFOEV databases. It investigates the relation of the time evolution of the profiles of outbursts in the individual bands (hard X-ray, medium/hard X-ray, and optical).
Results. This analysis shows that the X-ray intensity steeply rises only in the start of the optical outburst and steeply declines only when the optical outburst comes to its end. However, the 1.5–50 keV band intensity saturates and balances on a plateau during the outburst. (The longer the outburst, the longer its plateau.) The peak X-ray intensities of this series display a significantly narrower range than the optical ones (a factor of about two versus a factor of about eight). This implies a discrepancy between the mass flow through the disk and the production of the X-ray emission via bremsstrahlung at the polar caps of the white dwarf. This discrepancy is the largest in the time of the peak optical intensity when the whole disk (or at least its inner part) is in the hot state and the flow of matter through the disk is the greatest. This study shows that a series of outbursts constitutes more general properties of this discrepancy. I argue that the saturation of the X-ray luminosity in outburst cannot be caused by a dominant increase in X-ray absorption. In the interpretation, large structural changes of the accreting regions at the magnetic poles of the white dwarf occur during the outburst. A buried shock proposed by some authors for polars is also promising for explaining the X-ray light curves of outbursts of GK Per.
Key words: accretion, accretion disks / radiation mechanisms: general / novae, cataclysmic variables / X-rays: binaries / circumstellar matter / stars: individual: GK Persei
© ESO, 2015
1. Introduction
Dwarf novae (DNe) are a type of cataclysmic variables (CVs) that are binary systems containing a mass-accreting white dwarf (WD) (see, e.g., Warner 1995, for a review). DNe display strong outbursts that are interpreted in terms of a thermal-viscous instability of the accretion disk (e.g., Smak 1984; Hameury et al. 1998). In the optical band, thermal emission of the disk dominates during this outburst. The optical brightness of DNe strongly rises during the outburst (typically by 2–5 mag), which is caused by a transition of the disk from the cool state to the hot state. This leads to accretion of the matter from the disk onto the WD. However, the variations in the X-ray intensity during the outburst differ from one DN to another. For example, the hard X-ray intensities (the energies E> 2 keV) of SU UMa (Collins & Wheatley 2010) and SS Cyg (Wheatley et al. 2003) displayed deep depressions with respect to the quiescent level. A strong brightening of SS Cyg was observed only in a very soft X-ray band (E< 0.5 keV). On the other hand, two DNe classified as the intermediate polars (IPs, CVs with the magnetized WD) (Watson et al. 1985), DO Dra (Szkody et al. 2002) and GK Per (e.g. Ishida et al. 1992; Hellier et al. 2004), displayed a large increase in the hard X-ray intensity (E> 2 keV) during their outbursts.
The behavior of X-ray intensity is interpreted in terms of bremsstrahlung emission and variations in the structure of the accretion region on the WD. In DNe considered to be non-magnetic (i.e., the magnetic field of the WD is weak so does not influence the accretion significantly), the accretion occurs via the boundary layer, which transitions from optically thin to optically thick during the rise of the outburst (Patterson & Raymond 1985). In some IP DNe, the accretion occurs onto the magnetic poles (polar caps) of the WD, not via the boundary layer (Norton & Watson 1989).
GK Per (A 0327+43) is an IP (Watson et al. 1985) with the orbital period Porb of 1.99 days (Crampton et al. 1986) and the WD spin period Pspin of 351 s (Watson et al. 1985). Nowadays, it undergoes 2–3 mag optical outbursts with a recurrence time of hundreds of days (e.g., Sabbadin & Bianchini 1983; Hudec 1981; Šimon 2002). These optical outbursts are accompanied by brightenings in X-rays (e.g., King et al. 1979; Evans et al. 2009). Kim et al. (1992) modeled the light curves of three similar outbursts (1975, 1981, and 1983) in the framework of the thermal-viscous instability disk model. This model was able to reproduce the basic features of the outbursts. It shows that the rise of the X-ray outburst can precede the optical one by up to about 100 days. Indeed, such a delay in the optical outburst was observed in one case (Bianchini & Sabbadin 1985; King et al. 1979).
The profiles of the outbursts of GK Per are unstable. Evans et al. (2009) show it on the deviating 2006 outburst that had a triple-peaked profile in the optical and UV bands. They attributed it to a series of the heating and cooling waves in the disk. These authors also demonstrate that the hard X-ray flux only accounts for a small fraction of the total energy liberated during the outburst. Both X-ray absorption and flux increase in outbursts of this IP (Ishida et al. 1992; Hellier et al. 2004). The emission of the outburst is fitted by thermal bremsstrahlung emission (Ishida et al. 1992). While X-ray absorption was of log NH(cm-2) ≈ 22 in quiescence, the X-ray spectrum of the 1989 outburst showed that two spectral components with the leaky absorbers of the much larger log NH(cm-2) ≈ 23 and log NH(cm-2) ≈ 24 were needed (Ishida et al. 1992). The hardness ratio of the spin modulation of X-rays in the 1996 outburst even suggests that it was caused by absorption with log NH(cm-2) ≈ 24.3 in a curtain connecting the inner disk region and the polar cap of the WD (Hellier et al. 2004). According to Hellier et al. (2004), a change in the accretion geometry also played a role in varying the X-ray profile of the spin modulation between quiescence and outburst.
In this paper, I investigate the relation of the optical and X-ray emissions and the deviations in a series of the consecutive outbursts. I analyze the relationship between the time evolution of the profiles of these outbursts in the hard X-ray, the medium/hard X-ray, and the optical bands. This analysis uses the X-ray data from the monitors onboard the RXTE and Swift satellites.
2. Observations
The AAVSO International database (Massachusetts, USA; Henden 2014) contains both the visual and CCD measurements of GK Per. If treated carefully, visual data can be very useful for analyzing the long-term activity (Percy et al. 1985; Richman et al. 1994). Accuracy even better than 0.1 mag can be achieved by averaging these data. This is quite sufficient for analyzes of large-amplitude variable objects like GK Per. Also the visual data from the database of AFOEV, operated at the CDS, Strasbourg, France, were included to increase the data coverage in some time segments. The band of the sensitivity of the visual data is similar to the V band. To be compatible with the optical band, I used only the V band CCD data. I checked the reliability of the visual measurements by comparing the visual and the CCD observations of GK Per included in the AAVSO database. The magnitudes determined by these two methods are in good agreement. The original file also contained the upper limits of brightness of GK Per. Inspection of the light curve revealed that the features are mapped well by the detections, so the upper limits were not necessary for this analysis. I used only the time segment of the optical light curve, which was also mapped by the X-ray observations mentioned below.
The All Sky Monitor (ASM) onboard the NASA satellite Rossi X-ray Timing Explorer (RXTE; Levine et al. 1996)1 observed GK Per between the years 1996 and 2011 and mapped a series of outbursts. The data file used here contains the sum band intensities IASM (1.5–12 keV). Since GK Per appears faint in the X-ray data even in outburst and since this analysis concentrates on the variations on timescales of days and longer, I used the one-day means and their uncertainties uASM provided by the ASM/RXTE team.
The Burst Alert Telescope (BAT) onboard the NASA satellite Swift, which has been operating since 2004 (Barthelmy et al. 2005; Krimm et al. 2013), also mapped several outbursts of GK Per in very hard X-rays (15–50 keV). This band is not divided into sub-bands. The analysis used the one-day means of the BAT intensity, IBAT, from the Swift data archive. Since both ASM/RXTE and BAT/Swift observations map several consecutive outbursts of GK Per, they give an opportunity to compare its activity in the optical band with those in the medium and very hard X-ray regions.
3. Data analysis
Since this analysis is devoted to investigating the relation of the activities in the optical, the ASM/RXTE, and the BAT/Swift spectral regions, only the segment of the optical light curve starting in 1996 was used. The optical light curve was submitted to a visual inspection. Several observations that deviated widely from the neighboring points in the light curve were rejected. During the outburst, GK Per displays quasiperiodic variations on the timescale of minutes and tens of minutes, with the peak-to-peak amplitude of several tenths of mag (e.g., Mazeh et al. 1985; Nogami et al. 2002). Because this analysis concentrates on the evolution of the outbursts on timescales of days and tens of days, I emphasized the profile of the outburst by binning the observations into one-day means. I made this binning separately for the visual and the CCD observations. The result is shown in Fig. 1a. In total, eight outbursts were mapped.
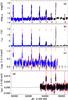 |
Fig. 1 Series of outbursts of GK Per in various spectral bands. a) Light curve in the optical band (one-day means) (magnitude scale). Closed circles represent the V band CCD measurements. Open circles denote the visual data. Short vertical lines denote the times of the conjunction with the Sun. b) The optical band (intensity scale). c) Two-sided moving averages of the ASM/RXTE data. Standard errors are marked. The vertical lines close to IASM = 0 ct s-1 mark the conjunction with the Sun. d) One-day means of the BAT/Swift observations. The points in the panels are connected by the lines to guide the eye. The vertical dashed lines denote the start and the end of the outburst in the optical band. The outbursts are numbered in panel a). See Sect. 3 for details. (This figure is available in color in the electronic edition.) |
Since the ASM and BAT measurements are given in intensities, I also transformed the optical data from magnitudes to intensities. For this purpose, I set the optical intensities Ivis (visual data) and I (V) (CCD V band data) equal to unity at the magnitude V = 13 (close to the quiescent level of brightness). This curve is plotted in Fig. 1b.
The start and the end of the optical outbursts of GK Per are often well defined. These timings (the dashed vertical lines in Fig. 1a) therefore served for comparing them with the behavior in various X-ray bands.
The angular distance between GK Per and the Sun is about 25 degrees in conjunction, so the X-ray emission from the Sun can enhance the noise level of the X-ray observations. These times of conjunction are marked in Figs. 1ac.
To lower the noise of the ASM/RXTE observations of GK Per, only the daily means with uASM smaller than 0.4 ct s-1 (counts per second) were used for most of this analysis. To pick out the structures in the light curve and to evaluate whether and how IASM varied during the optical outbursts, the light curve was smoothed by the two-sided moving averages of IASM. This method is described in Brockwell & Davis (1987). An ensemble of the moving averages with various filter half-widths Q (where Q refers to the semi-interval of days, within which the data were averaged) and steps of one day was generated. I found that the moving averages with Q = 10 d gave the best result. Although a smoothing by the moving averages revealed that the mean intensity measured in quiescence by ASM/RXTE is slightly shifted by about 0.2 ct s-1 from zero, the emission of GK Per (considered to be lost in the noise in quiescence) clearly rises during each optical outburst and stands out from the observing noise (Fig. 1c). The parts of the moving averages close to conjunction suffering from a larger noise were eliminated by applying the criterion of uASM smaller than 0.4 ct s-1 (Fig. 1c). Although the signal of GK Per measured by ASM/RXTE was weak, even at the peak IASM of the outburst, the moving averages enabled meaningful profiles of a series of outbursts to be obtained in these data. The error bars in the moving averages shown in Fig. 1c represent the standard error of all the data points included inside the segment of the length of 2Q + 1 d.
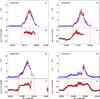 |
Fig. 2 Profiles of outbursts Nos. 1− 4 in GK Per. a), c), e), g) The light curve in the optical band (one-day means, intensity scale). Closed circles represent the V band CCD measurements. Open circles denote the visual data. Standard deviations of brightness of the one-day means of the optical data are shown. b), d), f), h) Moving averages of intensities in the ASM/RXTE data. Standard errors of intensities are given. The points in the individual panels are connected by the lines to guide the eye. The vertical dashed lines denote the start and the end of the outburst in the optical band. See Sect. 3 for details. (This figure is available in color in the electronic edition.) |
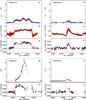 |
Fig. 3 Profiles of outbursts Nos. 5−8 in GK Per. a), d), g), i) Light curve in the optical band (one-day means, intensity scale). The arrangement is identical to that in Fig. 2. Vertical bars in panel g) represent the CCD series plotted in Fig. 4. b), e) Moving averages of intensities in the ASM/RXTE data. The arrangement is identical to that in Fig. 2. c), f), h), j) One-day means of the BAT/Swift observations. The uncertainties given by the BAT team are given. Open points represent the measurements with uBAT< 0.004 ct cm-2 s-1 in the gaps in panel h). See Sect. 3 for details. (This figure is available in color in the electronic edition.) |
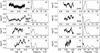 |
Fig. 4 Periodograms of rapid optical intensity variations in outburst No. 7 in GK Per (the intranight CCD data series marked in Fig. 3g). a), c), e), g), i), k), m), o) Series of data from a given night (the dates in the form of JD–2 400 000 are given). Each data set was investigated with the Lomb-Scargle method (b), d), f), h), j), l), n), p)). See Sect. 3 for details. |
BAT/Swift observed four outbursts of GK Per. Two of them were also mapped by ASM/RXTE. Inspections of the BAT data revealed that some measurements display a big uncertainty uBAT of intensity (listed in the original data files). Such data points introduce a high noise level. I found that setting the truncation limit of IBAT at uBAT = 0.0015 ct cm-2 s-1 solves this problem. Inspection of the data revealed that IBAT increased considerably during each of these four outbursts (Fig. 1d). In quiescence, IBAT is consistent with the observing noise.
Figures 2 and 3 show the profiles of the individual outbursts in detail. Although the optical intensity of the outburst peak varies widely for the individual outbursts in this series, the ASM intensity mutually attains more similar levels. A similar situation occurs also in the BAT band. While the peak optical intensity varies by a factor of about eight, the peak IBAT only varies by a factor of about two.
The start and the end of the outbursts in this series can be considered to be similar in all three bands (optical, ASM, and BAT). Since the moving averages smooth the features in the light curve, especially in the time segments with a smaller number of observations, I attribute the slightly earlier start of outbursts Nos. 3 and 4 to this effect. Indeed, the time difference between the start of the outburst in the ASM and the optical bands is not much greater than the value of Q used for smoothing the ASM data. A steep decrease in the X-ray intensity starts shortly before the end of the optical outburst. However, in most outbursts (except the short events Nos. 6 and 8), there are very large differences between the profiles in the optical and the X-ray bands in the surroundings of the optical peak. While each of the long events possesses at least one sharp peak in the optical light curve, the X-ray light curve remains relatively flat in this phase of the outburst. There is no peak in the ASM or the BAT band that would coincide with the peak(s) of the optical outburst. In this context, notice that although outburst No. 3 displays a prominent peak after the previous long plateau in the optical band, the ASM intensity remained close to the level of its plateau. A similar situation also occurred for event No. 5; while the optical outburst displayed three prominent peaks (see also Evans et al. 2009), the BAT light curve displayed only a significant increase in IBAT to a plateau above the quiescent level, but with at most marginal brightenings that would accompany the optical peaks. The ASM plateau of outburst No. 5 was similar to the one in the BAT band.
As for the seasonal gaps, I note that the features in the X-ray light curves of GK Per close to these gaps should be taken with caution. I therefore attribute the approximately six final points of outburst No. 3 (Fig. 2f) in the ASM band to increasing noise in the approaching seasonal gap.
The brightest event in the optical band, outburst No. 7, even displayed a temporary decrease in IBAT in the surroundings of its optical peak. To increase the coverage of this outburst by the BAT data and to shorten the seasonal gap, the measurements with uBAT< 0.004 ct cm-2 s-1 were included in the gaps of the BAT measurements with uBAT< 0.0015 ct cm-2 s-1 (Fig. 3h). This approach revealed that IBAT temporarily rebrightened in the late phase of this outburst. The time of the steep decline in IBAT sets the duration of the outburst, which turns out to be similar to that of outburst No. 5. In addition, these data enable resolving that the initial steep rise in IBAT starts almost simultaneously with the optical one.
As I discuss in Sect. 4, the high mass-accretion rate onto the WD, ṁacc, during an outburst of an IP can lead to a transition from the mode of accretion onto the magnetic poles of the WD to the mode via the boundary layer encircling the equator of the WD. This could change the hard X-ray intensity considerably. The presence of the spin modulation observed in the X-ray band during previous outbursts of GK Per (e.g., Hellier et al. 2004; Evans et al. 2009) suggested accretion onto the magnetic poles of the WD. In addition to the modulation with Pspin, GK Per also displayed a modulation with the cycle length PM of about 4000−5000 s in the X-ray (Watson et al. 1985; Hellier & Livio 1994; Hellier et al. 2004) and the optical bands (e.g., Mazeh et al. 1985; Morales-Rueda et al. 1999; Nogami et al. 2002). Two interpretations exist. While, according to Morales-Rueda et al. (1999), the optical modulation is caused by the beat frequency of  of the WD and the orbital period of the blobs in the inner disk region (giving thus their orbital period of 320 or 380 s), the X-ray observations can be better explained by the bulges in the inner disk, orbiting with the local Keplerian time scale of about 5000 s (Hellier et al. 2004). As discussed in Sect. 4, this modulation with PM can be used for assessing the accretion mode.
To investigate this mode in outburst No. 7 with a peculiar depression of IBAT, I therefore searched for the presence of the optical modulation with PM in the intranight CCD data series marked in Fig. 3g. Although the durations of the observing series are limited by the approaching seasonal gap, Fig. 4 displays the modulation on a typical timescale of several tens of minutes, which is visible to the naked eye. A search for periods used the Lomb-Scargle method (Lomb 1976), included in the code Peranso2. Figure 4 shows the result. The frequency range over which the intensity variations were searched for is similar to range used by Nogami et al. (2002). I found that the modulation with the cycle length of about 4000–5000 s is present in most night series in Fig. 4 regardless of what IBAT is.
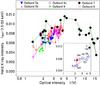 |
Fig. 5 Relation of the optical and BAT intensities during the series of outbursts of GK Per. The points of a given outburst are connected by the lines to show the time evolution (only the data with IBAT> 0.003 ct cm-2 s-1). Inset shows the remarkable points of these outbursts. See Sect. 3 for details. (This figure is available in color in electronic form.) |
Figure 5 shows the relation of the optical and BAT intensities during the series of outbursts. Only the points in which IBAT was larger than 0.003 ct cm-2 s-1 are plotted. This ensures that the observations that may detect only the noise at the start and the end of the outburst are omitted. In Fig. 5 that the intensities in both spectral regions steeply vary in the starting and the ending phases of the outbursts; the slopes are mutually similar for these events. Even the short and optically faint outbursts (Nos. 6 and 8) are able to reach the peak IBAT that is comparable to those of the optically significantly brighter events. The peak BAT intensity cannot be much higher, since in the brightest optical outburst in this series, No. 7, IBAT rises only in the initial part of the optical rise. The point abbreviated as “7 rise” represents the time of the peak IBAT, reached on the rising branch of this optical outburst.
A further rise of I (V) toward the optical peak even produced a gradual decrease in IBAT below the level of the considerably fainter optical outbursts. The longest shift of outburst No. 7 in Fig. 5 can also be used for clarifying the behavior of the triple-peaked outburst No. 5. The BAT intensities of this outburst varied little no matter whether the I (V) values were in one of the peaks or in the local minimum between them. In the inset of Fig. 5, the peaks are marked as 5A, 5B, and 5C, and the local minima between these peaks are abbreviated as 5ab and 5bc. These features of outburst No. 5 were in the region in which IBAT was close to its global maximum, so the variations in I (V) did not influence it significantly.
4. Discussion
I report on the profiles of a series of consecutive DN outbursts of GK Per in various spectral bands (hard X-ray, medium/hard X-ray, and optical). This enables a peculiar relation of intensities of the emissions coming from various processes to be identified in the accretion disk and in the accretion regions on the WD.
The time evolution of most outbursts of this series in GK Per strongly differs for the individual spectral bands. The largest discrepancies between intensities in the optical and the X-ray bands occur in the phase of the peak of the optical light curve where thermal emission of the disk by far dominates. The peak X-ray intensities of this series display a significantly narrower range than the optical ones (a factor of about two versus a factor of about eight). Even the faintest optical outburst is able to produce the X-ray luminosity close to the peak X-ray one of the whole series in a given band (especially in the BAT band Fig. 5). The luminosity in the 1.5–50 keV band saturates and balances on the plateau. (The longer the outburst, the longer its plateau.) I show that this luminosity does not follow the increase in the optical one; the bremsstrahlung luminosity even temporarily decreased in the surroundings of the peak optical luminosity of the disk of outburst No. 7. According to Evans et al. (2009), only a small fraction of the accreting matter in outburst No. 5 contributed to the 0.3–10 keV luminosity. I show that a series of outbursts with the remarkably different profiles constitutes more general properties of this discrepancy, which is even present in the hard band with E between 15 and 50 keV.
According to the model of Hameury et al. (1998, and of Kim et al. 1992, specifically for GK Per), the strongest mass flow (by several orders of magnitude larger than in quiescence) through the disk occurs in the time of the peak optical luminosity of the DN outburst. I note that the X-ray spectrum of the outburst of GK Per in 1989 (preceding thus this series) was very hard (Ishida et al. 1992), which means that the system would be bright in both the ASM and the BAT bands. The profile of the optical light curve of the 1989 event (a single peak at ~11.4 mag, duration of the outburst of ~55 d (AAVSO database, Henden 2014)) was in good agreement with outbursts Nos. 1−3 of this series, so it is acceptable to use it for comparison. The peak column density of the mass flow though the disk, as predicted by the model of Hameury et al. (1998), should therefore lead to the peak of the X-ray luminosity of GK Per in the ASM and the BAT bands. In GK Per, this luminosity is radiated in the accretion regions at the polar caps of the WD. However, the observed saturation of the X-ray intensity and its plateau in this series do not correspond to it.
The largest discrepancies between the optical and X-ray intensities occur in the time of the peak optical intensity of GK Per when the whole disk (or at least its inner part) are in the hot state and the flow of matter through the disk is greatest. This implies a discrepancy between the mass flow through the disk and the production of the X-ray emission via bremsstrahlung at the polar caps of the WD. The observed X-ray intensity of GK Per depends on the instantaneous value of the mass flow through the disk, not on the history of the given outburst (especially in the optically brightest outburst No. 7 with its rebrightening of IBAT, which suggests a return of the properties of the accretion region to the form that it had in the early phase of the outburst).
All eight outbursts in this series can be considered to have their onsets in the optical and X-ray bands almost simultaneous (especially as regards the BAT data), which can be explained by the inside-out type of outburst, following the model of Smak (1984). This fact emphasizes that the properties of the outbursts of GK Per vary with time in a peculiar way; please note the odd structure of the 1978 X-ray outburst. While this event peaked in the brightness of ~12 mag, which was comparable to that of the short outburst No. 6 (Fig. 1), the time delay of the rise in its optical emission after the rise of the X-ray one largely differed (no delay in No. 6, but at least 20 days in 1978, Bianchini & Sabbadin 1985). This suggests that the outbursts of this series constitute a uniform group (albeit with very different peak optical intensities), while the 1978 event was remarkably discrepant in this regard. Following the model of Kim et al. (1992), this can be explained if the stagnation phase occurred only in the 1978 outburst, not in this series. The occurrence of the stagnation phase thus does not depend on the peak optical luminosity of the disk in a given outburst.
If the X-ray plateau in this series of outbursts were caused purely by a strong increase in absorption of X-rays, then the IASM curve should be influenced more than the IBAT one. This is because IASM is more sensitive to absorption (see the coefficients of Morrison & McCammon 1983). Especially the IASM curve should display a round, gradual transition to or from the plateau because otherwise absorption of the accretion region would have to change abruptly by a large amount in the phases (quite similar for various outbursts) when the heating/cooling fronts are still traveling through the disk. Another argument against absorption as the dominant cause of the plateau is that both the initial rising and the final declining branches of the outbursts in the BAT data are very steep. Even the large increase in NH discovered by Ishida et al. (1992) and Hellier et al. (2004) cannot influence the profile of the outburst in the BAT band dramatically to produce a long plateau. Moreover, outburst No. 4 (Fig. 2) displays a strong optical peak after a long optical plateau. In contrast, the plateau of the IASM curve continues for all this time; only some well-tuned conspiracy of an increase in IASM and an increase in its absorption would balance the X-ray intensity of outburst No. 4. In the presented interpretation, although the mass flow through the inner disk region and the column density increased during the peak of the optical intensity, it did not influence the intensity of the bremsstrahlung emission in the ASM and the BAT bands significantly. Another argument against X-ray absorption as the cause of the plateau is that this saturation also persisted during the multipeak structure of the optical emission of outburst No. 5.
Changes in the structure of the accretion region are worth considering to explain this discrepancy between the time evolutions of the optical and the X-ray intensities in GK Per. In IPs, the division between accretion onto the polar caps and accretion via boundary layer depends on the ram pressure of the accreting matter (Warner 1995). In principle, an increase in this ram pressure in outburst can diminish the inner radius of the truncated disk, and even create a boundary layer encircling the WD. This can change IASM and IBAT considerably. Changes in the structure of the boundary layer from optically thin in quiescence to optically thick in outburst can explain a decrease in the 2–18.5 keV intensity below its quiescent value in the non-magnetic SU UMa (Collins & Wheatley 2010). Nevertheless, the spin modulation of the WD, repeatedly detected in the X-ray band in outbursts of GK Per (e.g., Watson et al. 1985; Hellier et al. 2004; Vrielmann et al. 2005; Evans et al. 2009), shows that accretion still proceeded onto the polar caps on the WD. The situation of the brightest optical outburst of this series, No. 7, in which the column density of the hot-state disk, hence the ram pressure, could be higher than in other outbursts, requires discussion.
With only the data from the X-ray monitors, I substituted a search for the accretion mode in the following way. The model of Warner & Woudt (2002) provides an explanation of two quasiperiodic phenomena in CVs: quasi-periodic oscillations (QPOs) are caused by a vertical thickening, which moves as a traveling wave near the inner edge of the disk, while dwarf nova oscillations (DNOs) are interpreted as an equatorial belt of the WD with a variable angular velocity. If Pspin of the WD in GK Per is identified with the period of DNOs, PDNO, and PM with the period of QPOs, PQPO (Hellier et al. 2004), then the position of this system conforms to the relation PQPO/PDNO ≈ 15, found for many CVs and X-ray binaries by Warner et al. (2003). GK Per has the longest periods of both QPOs and DNOs in that diagram. This can be attributed to a significant gap between the inner disk region and the WD surface in its outburst (about 1−2 radii of the WD according to Hellier et al. 2004). The modulation with PM is present in most night series in outburst No. 7 (Fig. 4), no matter what IV and IBAT are. The deviating PM in some nights (Figs. 4k and o) can be explained if more than a single wave were temporarily present in the inner disk region in a given time. Since the optical modulation of the brightest optical outburst No. 7 (Fig. 4) is analogous to what is observed in the previous outbursts, I also ascribe a significant gap between the inner disk region and the WD (hence accretion onto the magnetic poles) to this event. The depression of IBAT was thus not caused by a change in the accretion mode and the formation of boundary layer.
The large discrepancy of the optical and X-ray intensities, with the deficiency of the X-ray luminosity of the caps, during the outbursts of GK Per can suggest an outflow of part of the accreting mass from the inner disk and/or from the accretion region (e.g., from the curtains). Also, Evans et al. (2009) argue that only a small fraction of the accreting matter in outburst No. 5 contributed to the 0.3–10 keV luminosity. Also the structural changes in the accretion regions on the poles of the WD themselves in the bright outbursts of GK Per may lead to the discrepancy between these luminosities. For example, buried shock was proposed for some polars with a very high specific mass accretion rate (i.e., the rate per a unit surface of the accretion region) by Wickramasinghe & Ferrario (2000).
Such a large mass inflow can create a depression in the WD. In GK Per, the flares with E< 1 keV, which were ascribed to the thermalized emission on the WD surface, were caused by the impacts of the blobs (Vrielmann et al. 2005). This speaks in favor of creating such a depression. The radiation drag (Yi & Vishniac 1994) is unlikely as the sole explanation of the plateau of the X-ray light curves in GK Per. This is because such a drag should strengthen gradually with the increasing ṁacc, while the plateau occurs rapidly after crossing some threshold. Nevertheless, it can explain the depression of the BAT curve in the optically very bright outburst No. 7. The advantage of the radiation drag is that it depends on ṁacc, so it can easily account for the rebrightening of IBAT during the decay of the optical light curve from the peak of this outburst.
This study shows that only investigating the properties of a series of the DN outbursts of GK Per, in which episodic increases in the mass inflow onto the magnetized WD occur, can lead to explaining the more general properties of the discrepancy of the light curves in various spectral bands. In this interpretation, large structural changes of the accreting regions at the magnetic poles of the WD, invoked by crossing some threshold of the mass flow through the disk, play an important role in explaining these light curves.
Acknowledgments
Support by grants 13-33324S and 13-39464J of the Grant Agency of the Czech Republic is acknowledged. This research has made use of the observations provided by the ASM/RXTE teams at MIT and at the RXTE SOF and GOF at NASA’s GSFC. I also used public data from the Swift data archive. I acknowledge with thanks the variable star observations from the AAVSO International database (Massachusetts, USA) and from the AFOEV database, operated at the CDS, Strasbourg, France. I thank the variable star observers worldwide whose observations made this analysis possible.
References
- Barthelmy, S. D., Barbier, L. M., Cummings, J. R., et al. 2005, Space Sci. Rev., 120, 143 [NASA ADS] [CrossRef] [Google Scholar]
- Bianchini, A., & Sabbadin, F. 1985, IBVS, 2751 [Google Scholar]
- Brockwell, P. J., & Davis, R. A. 1987, Time Series: Theory and Methods (New York: Springer-Verlag) [Google Scholar]
- Collins, D. J., & Wheatley, P. J. 2010, MNRAS, 402, 1816 [NASA ADS] [CrossRef] [Google Scholar]
- Crampton, D., Cowley, A. P., & Fisher, W. A. 1986, ApJ, 300, 788 [NASA ADS] [CrossRef] [Google Scholar]
- Evans, P. A., Beardmore, A. P., Osborne, J. P., et al. 2009, MNRAS, 399, 1167 [NASA ADS] [CrossRef] [Google Scholar]
- Hameury, J.-M., Menou, K., Dubus, G., et al. 1998, MNRAS, 298, 1048 [NASA ADS] [CrossRef] [Google Scholar]
- Hellier, C., Harmer, S., & Beardmore, A. P. 2004, MNRAS, 349, 710 [NASA ADS] [CrossRef] [Google Scholar]
- Henden, A. A. 2014, Observations from the AAVSO International Database, http://www.aavso.org/data-download [Google Scholar]
- Hudec, R. 1981, Bull. Astron. Inst. Czechosl., 32, 93 [NASA ADS] [Google Scholar]
- Ishida, M., Sakao, T., Makishima, K., et al. 1992, MNRAS, 254, 647 [NASA ADS] [CrossRef] [Google Scholar]
- Kim, S.-W., Wheeler, J. C., & Mineshige, S. 1992, ApJ, 384, 269 [NASA ADS] [CrossRef] [Google Scholar]
- King, A. R., Ricketts, M. J., & Warwick, R. S. 1979, MNRAS, 187, 77 [NASA ADS] [CrossRef] [Google Scholar]
- Krimm, H. A., Holland, S. T., Corbet, R. H. D., et al. 2013, ApJS, 209, 14 [NASA ADS] [CrossRef] [Google Scholar]
- Levine, A. M., Bradt, H., Cui, W., et al. 1996, ApJ, 469, L33 [NASA ADS] [CrossRef] [Google Scholar]
- Lomb, N. R. 1976, Ap&SS, 39, 447 [NASA ADS] [CrossRef] [Google Scholar]
- Mazeh, T., Tal, Y., Shaviv, G., et al. 1985, A&A, 149, 470 [NASA ADS] [Google Scholar]
- Morales-Rueda, L., Still, M. D., & Roche, P. 1999, MNRAS, 306, 753 [NASA ADS] [CrossRef] [Google Scholar]
- Morrison, R., & McCammon, D. 1983, ApJ, 270, 119 [NASA ADS] [CrossRef] [Google Scholar]
- Nogami, D., Kato, T., & Baba, H. 2002, PASJ, 54, 987 [NASA ADS] [Google Scholar]
- Norton, A. J., & Watson, M. G. 1989, MNRAS, 237, 853 [NASA ADS] [CrossRef] [Google Scholar]
- Patterson, J., & Raymond, J. C. 1985, ApJ, 292, 535 [NASA ADS] [CrossRef] [Google Scholar]
- Percy, J. R., Fabro, V. A., & Keith, D. W. 1985, J. AAVSO, 14, 1 [NASA ADS] [Google Scholar]
- Richman, H. R., Applegate, J. H., & Patterson, J. 1994, PASP, 106, 1075 [NASA ADS] [CrossRef] [Google Scholar]
- Šimon, V. 2002, A&A, 382, 910 [NASA ADS] [CrossRef] [EDP Sciences] [Google Scholar]
- Smak, J. 1984, Acta Astron., 34, 161 [NASA ADS] [Google Scholar]
- Sabbadin, F., & Bianchini, A. 1983, A&AS, 54, 393 [NASA ADS] [Google Scholar]
- Szkody, P., Nishikida, K., Erb, D., et al. 2002, AJ, 123, 413 [NASA ADS] [CrossRef] [Google Scholar]
- Vrielmann, S., Ness, J.-U., & Schmitt, J. H. M. M. 2005, A&A, 439, 287 [NASA ADS] [CrossRef] [EDP Sciences] [Google Scholar]
- Warner, B. 1995, Cataclysmic Variable Stars (Cambridge: Cambridge Univ. Press) [Google Scholar]
- Warner, B., & Woudt, P. A. 2002, MNRAS, 335, 84 [NASA ADS] [CrossRef] [Google Scholar]
- Warner, B., Woudt, P. A., & Pretorius, M. L. 2003, MNRAS, 344, 1193 [NASA ADS] [CrossRef] [Google Scholar]
- Watson, M. G., King, A. R., & Osborne, J. 1985, MNRAS, 212, 917 [NASA ADS] [CrossRef] [Google Scholar]
- Wheatley, P. J., Mauche, C. W., & Mattei, J. A. 2003, MNRAS, 345, 49 [NASA ADS] [CrossRef] [Google Scholar]
- Wickramasinghe, D. T., & Ferrario, L. 2000, New Astron. Rev., 44, 69 [Google Scholar]
- Yi, I., & Vishniac, E. T. 1994, ApJ, 435, 829 [NASA ADS] [CrossRef] [Google Scholar]
All Figures
|
Fig. 1 Series of outbursts of GK Per in various spectral bands. a) Light curve in the optical band (one-day means) (magnitude scale). Closed circles represent the V band CCD measurements. Open circles denote the visual data. Short vertical lines denote the times of the conjunction with the Sun. b) The optical band (intensity scale). c) Two-sided moving averages of the ASM/RXTE data. Standard errors are marked. The vertical lines close to IASM = 0 ct s-1 mark the conjunction with the Sun. d) One-day means of the BAT/Swift observations. The points in the panels are connected by the lines to guide the eye. The vertical dashed lines denote the start and the end of the outburst in the optical band. The outbursts are numbered in panel a). See Sect. 3 for details. (This figure is available in color in the electronic edition.) |
| In the text | |
|
Fig. 2 Profiles of outbursts Nos. 1− 4 in GK Per. a), c), e), g) The light curve in the optical band (one-day means, intensity scale). Closed circles represent the V band CCD measurements. Open circles denote the visual data. Standard deviations of brightness of the one-day means of the optical data are shown. b), d), f), h) Moving averages of intensities in the ASM/RXTE data. Standard errors of intensities are given. The points in the individual panels are connected by the lines to guide the eye. The vertical dashed lines denote the start and the end of the outburst in the optical band. See Sect. 3 for details. (This figure is available in color in the electronic edition.) |
| In the text | |
|
Fig. 3 Profiles of outbursts Nos. 5−8 in GK Per. a), d), g), i) Light curve in the optical band (one-day means, intensity scale). The arrangement is identical to that in Fig. 2. Vertical bars in panel g) represent the CCD series plotted in Fig. 4. b), e) Moving averages of intensities in the ASM/RXTE data. The arrangement is identical to that in Fig. 2. c), f), h), j) One-day means of the BAT/Swift observations. The uncertainties given by the BAT team are given. Open points represent the measurements with uBAT< 0.004 ct cm-2 s-1 in the gaps in panel h). See Sect. 3 for details. (This figure is available in color in the electronic edition.) |
| In the text | |
|
Fig. 4 Periodograms of rapid optical intensity variations in outburst No. 7 in GK Per (the intranight CCD data series marked in Fig. 3g). a), c), e), g), i), k), m), o) Series of data from a given night (the dates in the form of JD–2 400 000 are given). Each data set was investigated with the Lomb-Scargle method (b), d), f), h), j), l), n), p)). See Sect. 3 for details. |
| In the text | |
|
Fig. 5 Relation of the optical and BAT intensities during the series of outbursts of GK Per. The points of a given outburst are connected by the lines to show the time evolution (only the data with IBAT> 0.003 ct cm-2 s-1). Inset shows the remarkable points of these outbursts. See Sect. 3 for details. (This figure is available in color in electronic form.) |
| In the text | |
Current usage metrics show cumulative count of Article Views (full-text article views including HTML views, PDF and ePub downloads, according to the available data) and Abstracts Views on Vision4Press platform.
Data correspond to usage on the plateform after 2015. The current usage metrics is available 48-96 hours after online publication and is updated daily on week days.
Initial download of the metrics may take a while.