Fig. 1
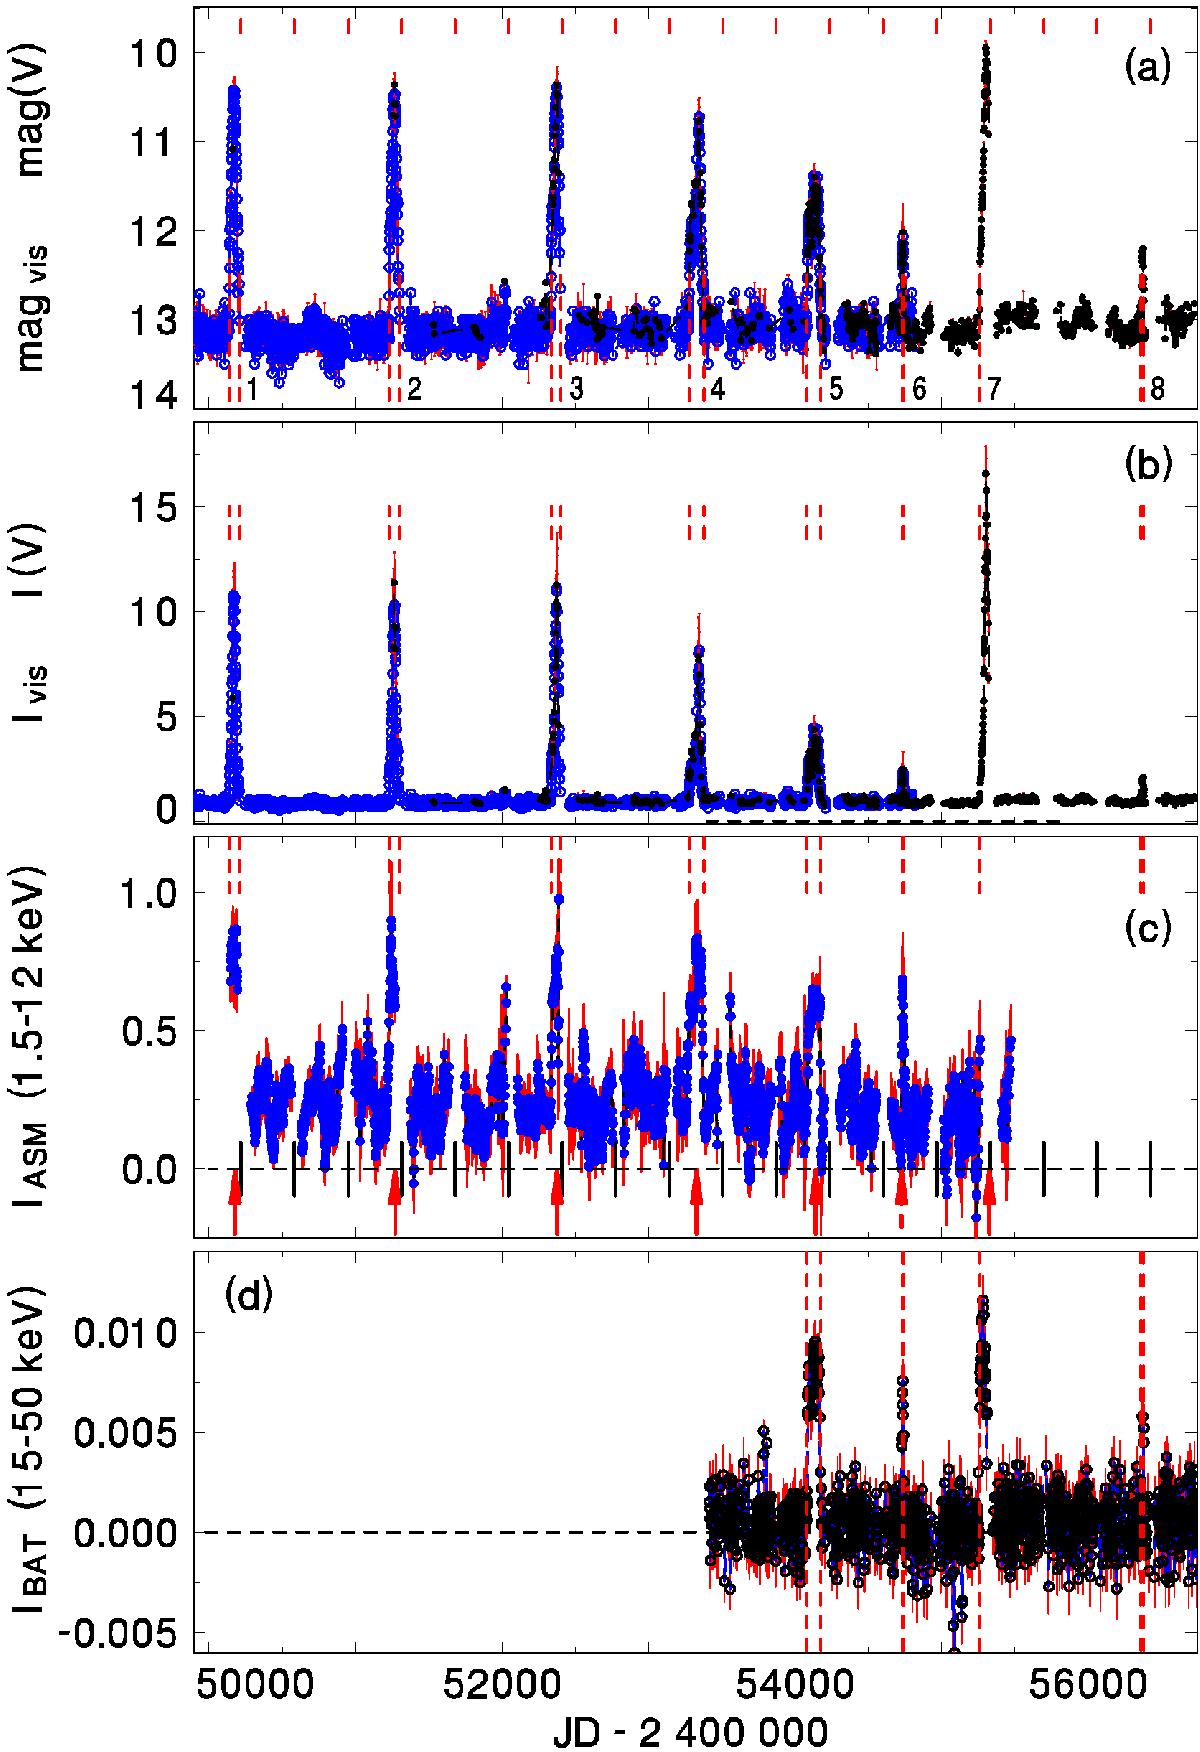
Series of outbursts of GK Per in various spectral bands. a) Light curve in the optical band (one-day means) (magnitude scale). Closed circles represent the V band CCD measurements. Open circles denote the visual data. Short vertical lines denote the times of the conjunction with the Sun. b) The optical band (intensity scale). c) Two-sided moving averages of the ASM/RXTE data. Standard errors are marked. The vertical lines close to IASM = 0 ct s-1 mark the conjunction with the Sun. d) One-day means of the BAT/Swift observations. The points in the panels are connected by the lines to guide the eye. The vertical dashed lines denote the start and the end of the outburst in the optical band. The outbursts are numbered in panel a). See Sect. 3 for details. (This figure is available in color in the electronic edition.)
Current usage metrics show cumulative count of Article Views (full-text article views including HTML views, PDF and ePub downloads, according to the available data) and Abstracts Views on Vision4Press platform.
Data correspond to usage on the plateform after 2015. The current usage metrics is available 48-96 hours after online publication and is updated daily on week days.
Initial download of the metrics may take a while.