Fig. 3
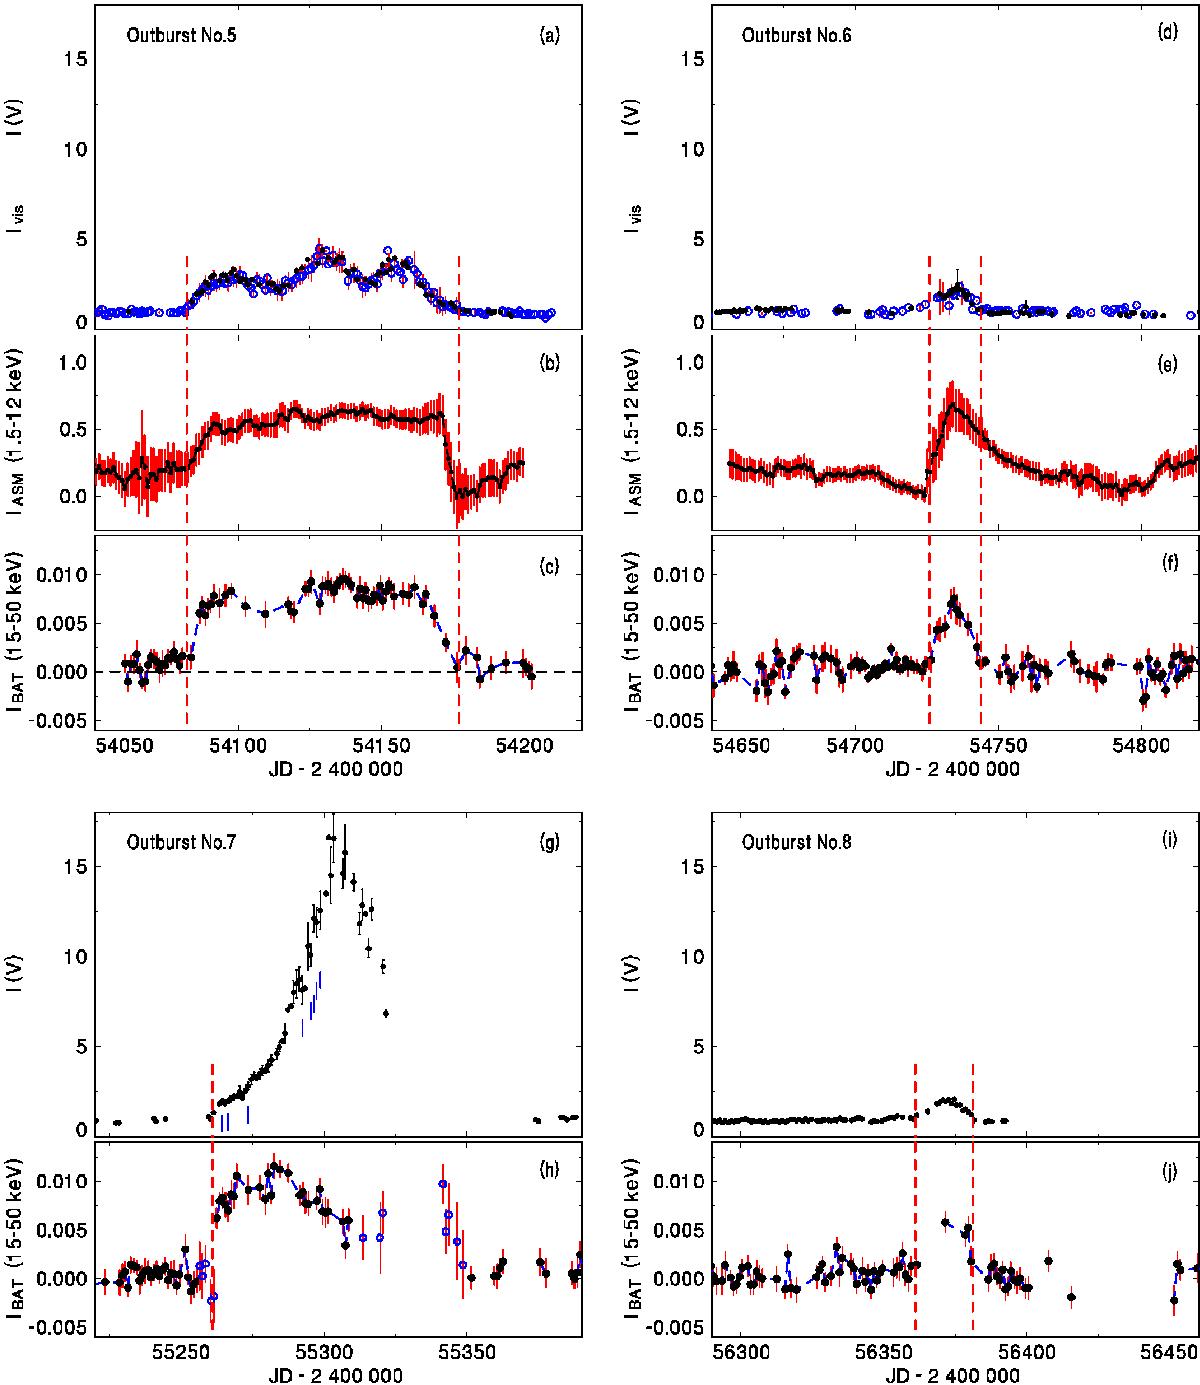
Profiles of outbursts Nos. 5−8 in GK Per. a), d), g), i) Light curve in the optical band (one-day means, intensity scale). The arrangement is identical to that in Fig. 2. Vertical bars in panel g) represent the CCD series plotted in Fig. 4. b), e) Moving averages of intensities in the ASM/RXTE data. The arrangement is identical to that in Fig. 2. c), f), h), j) One-day means of the BAT/Swift observations. The uncertainties given by the BAT team are given. Open points represent the measurements with uBAT< 0.004 ct cm-2 s-1 in the gaps in panel h). See Sect. 3 for details. (This figure is available in color in the electronic edition.)
Current usage metrics show cumulative count of Article Views (full-text article views including HTML views, PDF and ePub downloads, according to the available data) and Abstracts Views on Vision4Press platform.
Data correspond to usage on the plateform after 2015. The current usage metrics is available 48-96 hours after online publication and is updated daily on week days.
Initial download of the metrics may take a while.