Free Access
Fig. 9
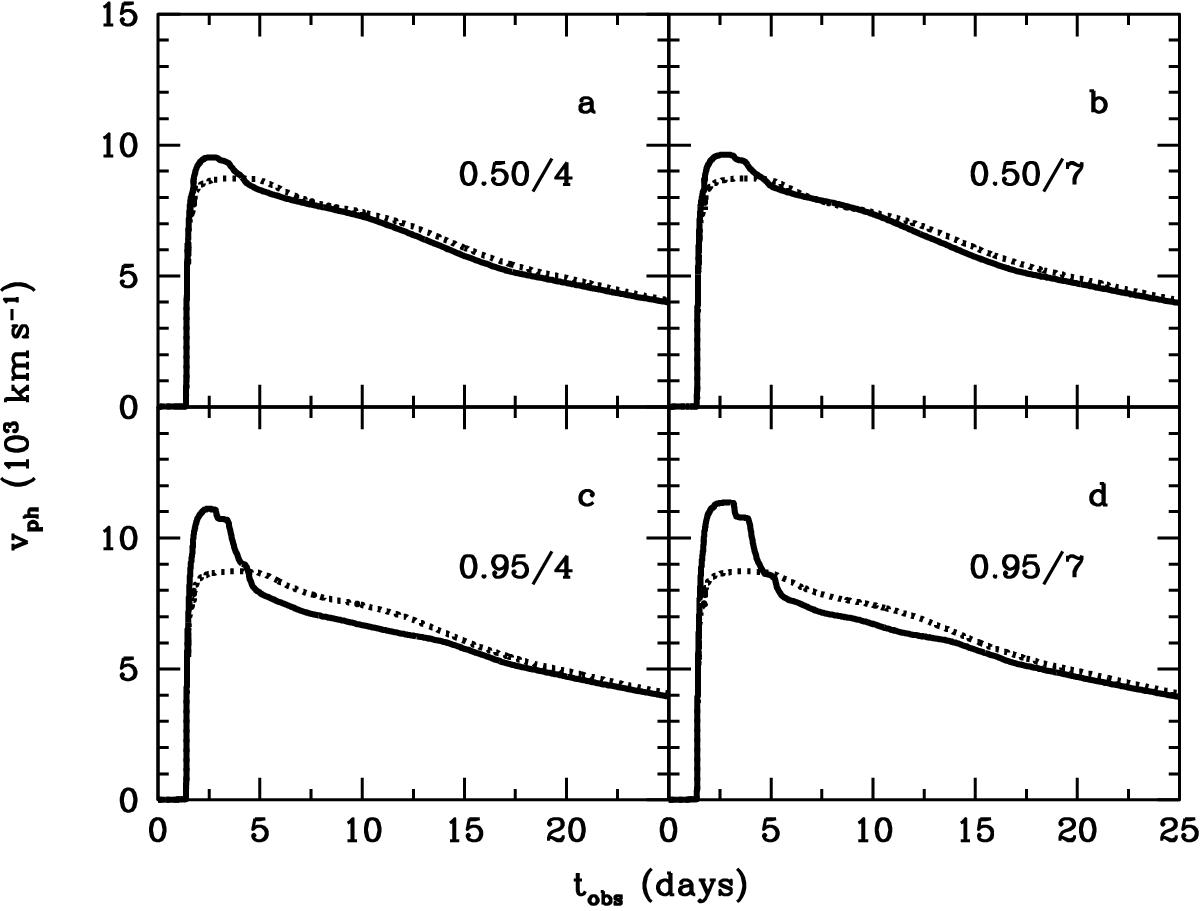
Photospheric velocity evolution (thick line) for the different mass fraction of clumps μ0 and density contrast χ0 indicated in each panel. The photospheric velocity of the best-fit model for the smooth medium is shown by the dotted line.
Current usage metrics show cumulative count of Article Views (full-text article views including HTML views, PDF and ePub downloads, according to the available data) and Abstracts Views on Vision4Press platform.
Data correspond to usage on the plateform after 2015. The current usage metrics is available 48-96 hours after online publication and is updated daily on week days.
Initial download of the metrics may take a while.