Free Access
Fig. 5
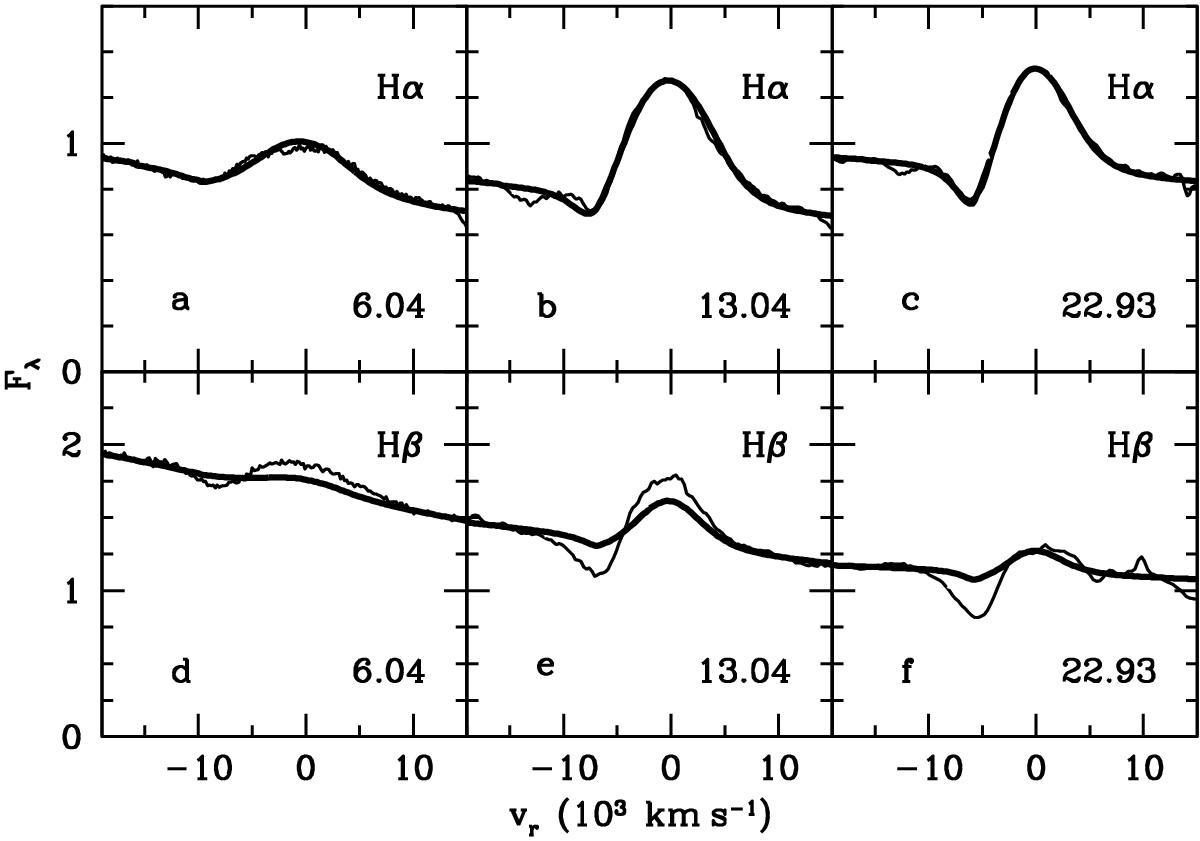
Observed Hα (upper panels) and Hβ (lower panels) (Tomasella et al., 2013) in SN 2012A on days 7, 14, and 23 (thin line) compared to the model profiles (thick line). The model parameters are adjusted to fit the observed Hα. For these models, however, the calculated Hβ is unable to fit the observed profile.
Current usage metrics show cumulative count of Article Views (full-text article views including HTML views, PDF and ePub downloads, according to the available data) and Abstracts Views on Vision4Press platform.
Data correspond to usage on the plateform after 2015. The current usage metrics is available 48-96 hours after online publication and is updated daily on week days.
Initial download of the metrics may take a while.