| Issue |
A&A
Volume 575, March 2015
|
|
|---|---|---|
| Article Number | A39 | |
| Number of page(s) | 10 | |
| Section | The Sun | |
| DOI | https://doi.org/10.1051/0004-6361/201424754 | |
| Published online | 18 February 2015 | |
A coronal wave and an asymmetric eruptive filament in SUMER, CDS, EIT, and TRACE co-observations⋆
Armagh Observatory, College Hill, Armagh BT61 9DG, N. Ireland
e-mail:
This email address is being protected from spambots. You need JavaScript enabled to view it.
Received: 5 August 2014
Accepted: 31 October 2014
Abstract
Context. The investigation covers the complex subject of coronal waves and the phenomena contributing to and/or causing their formation.
Aims. The objectives of the present study is to provide a better physical understanding of the complex inter-relation and evolution of several solar coronal features comprising a double-peak flare, a coronal dimming caused by a coronal mass ejection (CME), a CME-driven compression, and a fast-mode wave. For the first time, the evolution of an asymmetric eruptive filament is analysed in simultaneous Solar Ultraviolet Measurement of Emitted Radiation (SUMER) spectroscopic and Transition Region and Coronal Explorer (TRACE) and Extreme-ultraviolet Imaging Telescope (EIT) imaging data.
Methods. We use imaging observations from EIT and TRACE in the 195 Å channel and spectroscopic observations from the Coronal Diagnostic Spectrometer (CDS) in a rastering and SUMER in a sit-and-stare observing mode. The SUMER spectra cover spectral lines with formation temperatures from log T(K) ~ 4.0 to 6.1.
Results. Although the event was already analysed in two previous studies, our analysis brings a wealth of new information on the dynamics and physical properties of the observed phenomena. We found that the dynamic event is related to a complex flare with two distinct impulsive peaks, one according to the Geostationary Operational Environmental Satellite (GOES) classification as C1.1 and the second – C1.9. The first energy release triggers a fast-mode wave and a CME with a clear CME driven compression ahead of it. This activity is related to, or possibly caused, by an asymmetric filament eruption. The filament is observed to rise with its leading edge moving at a speed of ~300 kms-1 detected both in the SUMER and CDS data. The rest of the filament body moves at only ~150 kms-1 while untwisting. No signature is found of the fast-mode wave in the SUMER data, suggesting that the plasma disturbed by the wave had temperatures above 600 000 K. The erupting filament material is found to emit only in spectral lines at transition region temperatures. Earlier identification of a coronal response detected in the Mg x 609.79 Å line is found to be caused by a blend from the O iv 609.83 Å line.
Conclusions. We present a unique analysis of the complex phenomenon called “EIT/coronal wave”, confirming its bimodal nature. We suggest that the disintegration of the dimming/CME and the CME-driven compression are either caused by a CME-CME interaction taking place in the low solar atmosphere or by an impulsive CME cavity overexpansion in the low solar atmosphere.
Key words: Sun: corona / Sun: transition region / Sun: activity / methods: observational / line: profiles
A movie associated to Fig. A.1 is available in electronic form at http://www.aanda.org
© ESO, 2015
1. Introduction
Coronal waves (CWs), also known as extreme-ultraviolet (EUV) and Extreme-ultraviolet Imaging Telescope (EIT) waves (hereafter coronal waves), are large-scale coronal transients observed in the form of a diffuse brightening that were first detected in observations taken by EIT (Delaboudinière et al. 1995) on board the Solar and Heliospheric Observatory (SoHO, Thompson et al. 1998). These waves are usually observed as moving, bright quasi-circular rings of increased emission in EUV wavelengths, mainly in the 195 Å imaging channels (1.6 MK) with a typical velocity of 200−400 kms-1. In 171 Å channels the CWs are seen as emission reduction with respect to the surrounding coronal emission, which is caused by heating and thus the ionization of Fe ix/x to higher ionisation states. Coronal waves are caused by the shock produced from the sudden energy release in active regions and are associated with coronal mass ejections (CMEs) rather than flares (Biesecker et al. 2002). Not all CMEs, however, are found to generate coronal waves (Biesecker et al. 2002). Moreton waves (i.e. a chromospheric wave, first reported by Moreton (1960) in Hα observations propagating with 1000 kms-1) are believed to be the chromospheric counterpart of coronal waves, with both waves showing similar behaviour (Veronig et al. 2006, and the references therein). Asai et al. (2012) reported on the first simultaneous co-spatial detection of a Moreton and a coronal wave.
Thanks to the high-cadence images from the Atmospheric Imaging Assembly (AIA) on board the Solar Dynamic Observatory (SDO), it was found that CWs show deceleration which is a typical characteristic of large-amplitude waves (Warmuth et al. 2004; Long et al. 2008; Veronig et al. 2008). Coronal wave fronts are reported to be anisotropic and non-homogeneous (Thompson et al. 1999). From observations with the Extreme Ultraviolet Imager (EUVI) on board STEREO-B, Veronig et al. (2010) found that coronal waves are dome shaped with erupting CME loops inside the dome. The CW properties can be found tabulated in Gallagher & Long (2011).
The nature of the phenomenon “coronal wave” is strongly disputed. The interpretations include fast-mode waves (Wills-Davey & Thompson 1999; Warmuth et al. 2001; Schmidt & Ofman 2010), slow-mode waves or solitons (Wills-Davey et al. 2007), and non-waves related to a current shell (Delannée et al. 2008) or successively reconnecting magnetic field lines at a CME front (Delannée et al. 2014; Attrill 2010, and the references therein). More details on the properties and modelling of coronal waves can be found in several reviews by Vršnak & Cliver (2008); Gallagher & Long (2011); and Patsourakos & Vourlidas (2012). The most recent review by Liu & Ofman (2014) summarises the very latest findings from AIA/SDO observations and modelling of coronal/EIT waves. The authors conclude that CWs clearly have a hybrid or bimodal nature with an outer EUV front of a true fast-mode wave that travels ahead of an inner non-wave component of CME-driven compression (see the composed Fig. 2 in their paper). They also suggest that heating due to electric current dissipation or magnetic reconnection may have a contribution to the EUV emission at the inner, CME front, but not the outer, true wave front. This complex nature of the phenomenon was already suggested by Forbes (2000). Zhukov & Auchère (2004) analysed two events that initiated close to the limb permitting the investigation of both the wave and the structure of the CMEs. The authors concluded that the observations suggest a bimodal phenomenon where the wave mode represents a wave-like propagating disturbance observed as a bright front that propagates to large distances from the dimming sites and has a quasi-circular appearance. The propagation of a dimming and EIT wave, as a result of successive opening of magnetic field lines during the CME lift-off, is regarded as an eruptive mode.
Spectroscopic observations of coronal waves and related phenomena are very important as they provide valuable information on their physical properties but are very limited because of the low chance of encountering transient phenomena in their limited field-of-view (FOV). Until present only very few observations were reported based on data from CDS on board SoHO and the EUV Imaging Spectrometer (EIS) on board Hinode (e.g. Harra & Sterling 2003; Veronig et al. 2011; Harra et al. 2011; Chen et al. 2011; Yang et al. 2013; Long et al. 2013).
Veronig et al. (2011) performed a detailed plasma diagnostics of a coronal wave based on EIS/Hinode observations. The authors measured Doppler velocities in Fe xii (log Tmax(K) = 6.1), Fe xiii (log Tmax(K) = 6.2), and Fe xvi (log Tmax(K) = 6.4) of up to 20 kms-1 (down-flows) at the wave front followed by up-flows of up to 5 kms-1. The down-flow represents the plasma pushed downwards by the wave followed by the up-flow, which is a signature of the relaxation of the plasma behind the wave front. Their density diagnostics reveals that enhanced density is not related to the wave front, but to the eruption behind the wave, i.e. it is not due to plasma compression at the wave front itself. They found no signature of the wave in He ii 256 Å (log T(K) = 4.7), which indicates that the upper chromosphere was not affected by the wave.
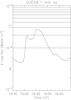 |
Fig. 1 GOES 9 1-min-averaged X-ray flux in the range 1−8 Å. |
SUMER spectral lines.
Harra & Sterling (2003) first investigated a phenomenon associated with a coronal wave using CDS raster observations. They studied the temperature response and the Doppler velocities of a feature trailing behind a coronal wave assumed to be an eruptive filament. The wave itself was not identified in the spectroscopic data, but was analysed in detail in the TRACE co-observations first by Wills-Davey & Thompson (1999) and later by Harra & Sterling (2003). The event discussed in these two papers is the subject of the present study.
Here, we report the first study of a coronal wave and related phenomena including flare, coronal mass ejection and filament eruption, using SUMER observations. The coronal wave was already studied in TRACE data by Wills-Davey & Thompson (1999) and CDS data (including a trailing eruptive feature believed to be a filament) by Harra & Sterling (2003; hereafter WT and HS, respectively). In our study we combined temporally and spatially the information provided by all three instruments, i.e. CDS, TRACE, and SUMER. We report the first SUMER observation of an eruptive filament. The paper is organised as follows: in Sect. 2, we describe the observational material. Section 3 introduces the studied phenomena and details from the two earlier studies. The imaging and spectroscopic data analysis, results, and discussion are given in Sects. 3.1 and 3.2, respectively. The conclusions are outlined in Sects. 4.
2. Observations
The observations used for the present study were taken on 1998 June 13 with the Solar Ultraviolet Measurements of the Emitted Radiation (SUMER) spectrometer and the CDS on board SoHO, and the TRACE imager. Synoptic observations in the Hα line from the Big Bear Solar Observatory were also used. A coronal wave was observed in the TRACE field-of-view followed by a dimming (the disk projection of a coronal mass ejection) originating in NOAA 08237. A flare with two impulsive phases, one reaching GOES C1.1 and the second reaching GOES C1.9 (Fig. 1), occurred in the time preceding the dimming and the wave. We will refer to this flare as “combined” flare. The EIT, TRACE and CDS data are described in Wills-Davey & Thompson (1999) and Harra & Sterling (2003). In the next section, we will provide some additional details on the CDS data that are important for the follow-up discussion.
The SUMER spectrometer (Wilhelm et al. 1995, 1997; Lemaire et al. 1997) was observing in a sit-and-stare mode with a 1″ × 300′′ slit and a 480 s exposure time on detector B. Two consecutive exposures in two spectral ranges centred at 770 Å and 1238 Å were taken in the disk centre starting at xcen = 0′′ and ycen = 0′′ at 15:39 UT. A compensation for the solar differential rotational was applied during the observations. A full spectral window, i.e. 1024 spectral pixels or ~40 Å, was telemetered to the ground. The observed spectral lines are listed in Table 1. Note that we list only the lines that were strong enough to be used in the present study. Standard data reduction procedures were applied to the data.
3. Analysis, results and discussion
3.1. Imaging analysis
The way slit spectrometers operate often makes the registration of dynamic transient phenomena quite a lucky coincidence. Motivated by the fact that no SUMER observations of coronal waves have ever been reported, we investigated existing reports on coronal waves in the search of such data. We were very fortunate to discover that during SUMER disk-centre observations, a “coronal wave” initiated in NOAA 08237 on 1998 June 13 propagated in a south-north direction moving under the SUMER slit.
The coronal phenomenon, shown here in Fig. 2, is best seen in the difference (running or base) TRACE 195 Å images, and appears as a bright ring ahead of a region with reduced emission. We will briefly review the findings of the two previous studies. First, Wills-Davey & Thompson (1999) described the coronal disturbance as registered in the TRACE data and identified it as an “EIT wave”. From the absence of the feature in the TRACE Lyman-α images and undisturbed low-lying loop structures (e.g. coronal bright points) with height up to 40′′, the authors concluded that the wave travelled at a height above 15 Mm. The authors interpreted the phenomenon as a fast-mode, magneto-acoustic wave possibly driven by a CME. From the combination of the 171 Å and 195 Å channels, they estimated that the wave was propagating through plasma with temperature in the range 1−1.4 MK. Using Huygens plotting technique, the velocities of the wave front was found to be in the range between 200 and 800 kms-1.
The second study by Harra & Sterling (2003) also analysed the phenomenon in the TRACE data but reached different conclusions. They identified a “weak” faster (500 kms-1) and a “bright” slower (200 kms-1) wave (see their article for more details). They also analysed co-temporally taken CDS raster spectra and found that the “weak” wave moves through the CDS FOV, but no “substantial line-shifts” were detected in the CDS spectra that made the authors conclude that the velocity should be less than 10 kms-1 (i.e. below the detection capabilities of CDS). Further on, their study concentrates on a feature that moves through the CDS FOV following the wave. Their analysis suggested that this phenomenon could possibly be a filament that had erupted during the flare. The Doppler-shift analysis showed two velocity components: one at 150 kms-1 in the lower part of the CDS FOV and a second component of 350 kms-1 that “proceeds from south to north”. The authors note that “the faster (350 kms-1) component is moving at a speed around 200 kms-1 in a north or northeasterly direction”. The phenomenon was detected in the Mg x 609.79 Å, O v 629.73 Å, and He i 584.33 Å lines, and the authors concluded that the material represents a cool filament ejected together with its hot surrounding. Harra & Sterling (2003) reached the conclusion that the observations show similarities with the numerical model of Chen et al. (2002) where a piston-driven shock (the “weak faster wave”) is triggered by a rising flux rope (i.e. the erupting filament). The “bright wave”, which has a slower propagation (≈200 kms-1), represents successive opening of the magnetic field lines covering the flux-rope/filament. Both WT and HS suggest that the event is driven by a CME.
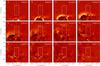 |
Fig. 2 TRACE running difference images. The solid line rectangle represents the CDS FOV. The dashed vertical line is the SUMER slit position. The over-plotted semicircles outline the border between the CME-driven compression and the dimming/CME. |
To correctly interpret the SUMER observations, we started our analysis by re-examining the TRACE and CDS data and combining them with the SUMER observations. In Fig. 2, we show a sequence of running difference images in the TRACE 195 Å channel over-plotted with the CDS raster field-of-view (FOV) and SUMER slit position. We would like to note that this study does not aim to help resolve the debate about the nature of the phenomenon “coronal/EIT/EUV wave”. We, however, strongly believe that the past ten years of theoretical and observational studies have provided enough evidence supporting the interpretation of coronal waves as having a hybrid nature, i.e. an outer EUV front of a true fast-mode wave that travels ahead of an inner non-wave component of a CME-driven compression (CDC; e.g. Shen & Liu 2012; Downs et al. 2012). The wave and non-wave feature (CDC) are often hard to distinguish in certain coronal conditions or when the propagation is close to the source region (Downs et al. 2011).
In light of the above definition, the “weak” fast wave as described by Harra & Sterling (2003) clearly represents the true fast-mode wave moving ahead of the “bright wave”, which is the CME-driven compression (Downs et al. 2012, 2011), also called a plasma pileup (Forbes 2000). After entering the TRACE FOV (at 15:28 UT, panel 1 in Fig. 2) the true wave and the CME-driven compression are impossible to separate as they are still very close to the source region, i.e. the active region. After 15:33 UT the wave moves ahead while the CDC disperses following the disintegration of the dimming/CME (discussed later in the text).
As we mentioned above, the flare presents two phases of energy release, the first at 15:06 UT classified as GOES C1.1 and the second at 15:34 UT classified as GOES C1.9. We estimated that the fast-mode wave driven by a CME was generated shortly after the first energy release. We used the available EIT data (see Fig. A.1) to obtain the position of the wave front as early as possible after the flare occurred (i.e. 15:24 UT) and to compare it with the wave front best seen in TRACE at 15:29 UT (Fig. 2). Note that the wave-front velocity could not be investigated in great detail because of the time cadence of the EIT and TRACE images. The wave-front velocity was found to be 500 ± 20 kms-1 calculated from both the EIT and TRACE images.
The sharp transition between the dimming (created by the CME bubble passing through the corona) and the bright semicircle (the CDC and the wave) outlined in Fig. 2, approximately traces the edge of the CME bubble. In Fig. 2, we present a series of TRACE 195 Å running difference images showing the series of events that took place. In Fig. A.1, we provide an animated sequence of images including, EIT running difference, TRACE 195 Å original, and TRACE running difference images, temporally combined. The tip of the dimming first appears in the TRACE FOV at 15:28 UT (panel 1 in Fig. 2). To separate the dimming expansion from its lateral displacement, we fitted a semicircle of a certain diameter on the sharp boundary between the dimming and the CDC. Between panels 1 and 2 the semicircle diameter increased from 30′′ (22 Mm) to 90′′ (65 Mm). As discussed in WT, the expected propagation height of the CW at this time is above 15 Mm. Low-lying coronal structures, such as coronal bright points, remained undisturbed by the wave (bright points heights range from 5 to 20 Mm (Brajša et al. 2004; Tian et al. 2007). The lateral speed of the dimming is shown in Table 2. Note that this is not the actual rising speed of the CME, but it represents the disk projection of a feature rising above the solar surface in a non-radial direction. This speed can be taken as a very low limit of the CME rise speed. For instance, Veronig et al. (2010) found that the velocity derived for the upward expansion of a wave dome above the limb was 650 kms-1, while the lateral expansion of the wave observed on-disk was 280 kms-1.
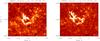 |
Fig. 3 Hα BBSO synoptic images with a field-of-view covering NOAA 08237. Left: a filament is visible lying along the magnetic neutral line. Right: the upper part of the filament has disappeared leaving a small undisturbed part. The image is de-rotated to the time of the image taken on June 12. |
From 15:29 UT to 15:34 UT, the dimming moves with a speed of ≈230 ± 20 kms-1. After 15:34 UT, its speed sharply drops to 80 kms-1 (see Table 2). The last image where the dimming is distinguishable enough to permit us to fit a semicircle is at 15:36 UT (panel 6 in Fig. 2). During the next three mins the whole dimming and the CDC region are fully dispersed. The true wave, however, continues moving undisturbed across the solar disk (northwards), reaching large coronal loops connecting NOAAs 08239 and 08238 to the north, triggering their excitation and resulting oscillation. The fast wave separates from the dimming/CME after 15:33 UT. The loop oscillations are clearly seen in panel 7 at 15:37 UT in Fig. 2 but it can already be spotted in panel 6 at 15:36 UT.
The time (15:33 UT) after which the CDC is seen “breaking” coincides with the appearance of a fast-moving bright elongated feature. The tip of this feature can be first noticed at the centre-bottom part of the dimming region at 15:31 UT (white arrow at 15:31 UT in the bright wave in Fig. 2). On the next image, at 15:33 UT, the feature has made a south to north motion with a speed of ≈320 ± 10 kms-1. Another similar looking feature (not visible at 15:31 UT) is seen above “breaking” through the dimming and the CDC region (see the upper arrow in Fig. 2). At this time, the fast-mode wave is clearly seen moving ahead.
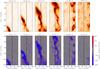 |
Fig. 4 CDS O v 629.74 Å radiance and Doppler-shift images showing the eruptive filament. |
The bright feature described above is then followed (panel 4 in Fig. 2) by a mostly dark (seen in absorption in EIT 195 Å) elongated, flux-rope-like phenomenon visible in the lower part of the dimming at 15:34 UT. Part of the flux rope appears bright but this still does not mean that the phenomenon contains plasma at coronal temperatures because the TRACE 195 Å channel has a strong contribution from transition-region emission (Brooks & Warren 2006). Judging from the appearance of the feature in the TRACE and CDS data, the phenomenon carries the observational description of an eruptive filament that was also suggested by HS. To confirm this, we inspected the only two existing Hα images of NOAA 08237 (Fig. 3). The images clearly show that a filament was present in the region the day before the flare, i.e. June 12, and part of it disappeared after the flare took place on June 13. Ribbons are formed along the neutral line where the filament was lying a day earlier. No other flaring activity has taken place between the time the two images were obtained, supporting the conclusion that this filament did indeed partially erupt during the flare on June 13.
Although on relatively low cadence, the available imaging data reveal important details on the physical picture of the observed complex phenomenon. We clearly see the propagation of what appears to be an on-disk imprint of a coronal mass ejection, i.e. a dimming region. It is apparent that the dimming/CME disintegrated with a “breaking” initiated in a small area of its leading edge. An eruptive filament is then seen moving through this “broken” region, which is then followed by a full dispersion of the dimming/CME. To put the series of events in a clear timeline from beginning to end is quite challenging, again because of the limited amount of data. The CME was ejected shortly after the first flare impulsive peak as was the CW. What causes the breaking and disintegration of the CME is a puzzle. A possible scenario is that two consecutive CMEs were triggered during the combined flare (i.e. two soft X-ray peaks) flare moving at different speeds, and, that the filament is part of the second CME. The “breaking” of the first CME can then be explained by a CME-CME interaction, with the second CME moving at higher speed. The whole series of events takes place relatively low in the solar atmosphere, i.e. below one solar radius. The eruption of several consecutive CMEs during a “combined” flare is not an unusual phenomenon. Most recently, Huang et al. (2014) reported on two consecutive CMEs ejected during a combined flare with three impulsive phases. A CME-CME interaction usually causes a change in the kinematics of one or both CMEs (e.g. Temmer et al. 2014) and is a physically sound mechanism for the observed breaking-up CME. Breaking of the CME bubble may also have occurred, caused by an impulsive CME bubble expansion that reached its maximum low in the solar atmosphere. Impulsive cavity over-expansions also triggering EUV waves, have been already reported by Patsourakos et al. (2010b,a). The low data cadence and the limited TRACE FOV do not permit us to perform a similar analysis.
As mentioned above, the online animation composed of a series of EIT running difference images, TRACE original, and TRACE running difference images (Fig. A.1), reveals important details on the eruptive filament. We use running difference images rather than base difference images (i.e. extracting from each image an image before the event) to better display the propagation of the filament. In the original TRACE 195 Å zoomed image, one can follow the rise of a dark looped feature with one end rising while moving across the solar disk. This evolution represents the typical behaviour of an asymmetric filament eruption meaning that one leg of the filament remains anchored in the chromosphere while the other one rises and the whole filament keeps untwisting until the flux rope is fully “straightened” (e.g. Madjarska et al. 1996; Joshi et al. 2013). The inspection of the EIT difference images shows that the filament erupted to a certain height with the “highest” position recorded in panel 12 in Fig. 2, and then fell back to the chromosphere. Because the eruption is non-radial, the on-disk position carries information about the “height” of the feature. Wills-Davey & Thompson (1999) reported that a CME recorded by LASCO C2 propagating through the South Pole (i.e. southwards from the NOAA 08237) is associated with the “EIT” wave. The CME is first registered in the LASCO C2 at 17:06 UT at a height of 3.25 R⊙, moving with a linear speed of 179 kms-1. A time-height plot (see the LASCO’s website) gives a solar origin time of the phenomenon shortly before 14:00 UT, which is more than an hour before the solar flare took place. In addition, the dimming is clearly seen propagating northwards and there is no distinguishable on-disk signature of a CME propagating southwards in the EIT data.
3.2. Spectral analysis
To the best of our knowledge, this is the first report of SUMER observations during a coronal wave and an eruptive solar filament. The SUMER spectrometer made four exposures, taking spectra in two wavelength bands. The first was centred at Ne viii 770 Å, while the second was in N v 1238 Å. The registered spectral lines with a sufficient signal-to-noise are given in Table 1. They cover the temperature range from 4.0 to 6.1 K (log Tmax). We should note that the Ne viii wavelength range only covers lines in the temperature range from 4.9 to 5.8 K (log Tmax), while the N v spectral window contains lines with lower and higher formation temperatures (see Table 1 for more details).
The filament enters the CDS FOV after 15:34 UT, but was actually scanned by the CDS slit during the raster starting at 15:37 UT. In the CDS intensity images (Fig. 4), the twisted flux rope of the filament is clearly noticeable. The CDS data were taken in several lines, including He i 584.33 Å, He ii 303.78 Å, O iv 554.51 Å (log Tmax = 5.2 K), O v 629.73 Å (log Tmax = 5.4 K), Ne vi 562.71 Å (log Tmax = 5.6 K), Mg x 609.79 Å (log Tmax = 6.0 K), and Fe xii 364.47 Å (log Tmax = 6.1 K). Harra & Sterling (2003) analysed the three lines He i, O v, and Mg x emitting at chromospheric, transition-region, and coronal temperatures. They detected the event in all three lines, concluding that plasma at “all these temperatures is being ejected simultaneously”. We need to make a small correction of this result and conclusion. The Mg x 609.79 Å is blended by O iv 609.83 Å (log Tmax = 5.2 K) and the two lines cannot be separated. In the quiet Sun and prominences the emission at 609 is dominated by O iv. The blend by the O iv line can be easily evaluated using the emission of O iv 554.51 Å. There are four O iv spectral lines around 554 Å, including O iv 553.33 Å, 554.076 Å, 554.51 Å and 555.26 Å. The O iv 555.26 Å and 553.33 Å can be excluded from the ratio calculation. The O iv 555.26 Å line is too far in the red wing off 554.51 Å, while only the red wing of O iv 553.33 Å may have any contribution. As the event is only registered in the blue wing, the line will have no effect on the blue wing of 554.51 Å. The ratio O iv (554.076+554.51)/609.83 derived using Chianti v.7.1.3 changes slightly with the temperature increasing from 3.65 at 100 000 K to 4.27 at 400 000 K, and remains close to the latter value at higher temperatures. We fitted the CDS line at 609.79 Å line with a double Gaussian fit to obtain the radiance in the wing and the rest component of the line and repeated the same for the O iv 554.51 Å. We used the raster starting at 15:42 UT. A small region of 5 × 3 pixels2 in the feature was used. We found a ratio for the wing of the two lines of 4.48, suggesting that the emission in the wing of the Mg x line is produced entirely by the blend of O iv 609.83 Å. To summarise, the feature moving through the CDS FOV is emitting predominantly and even fully at chromospheric and transition-region temperatures, which is consistent with the temperature emission range of solar prominences. The coronal emission whether the background or related to the event, is either negligible or above the formation temperature of Mg x.
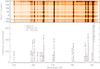 |
Fig. 5 Top panel: SUMER detector image taken at 15:39 UT. The region between the horizontal solid lines was used to produce the spectrum during the event. The same region was taken from the spectrum obtained earlier at 15:31 UT (before the event) to produce the reference spectrum. Bottom panel: the spectrum during the event is shown with a solid line, while the reference spectrum is shown with a dotted (red in the online version of the paper) line. “W” next to the line, e.g. “Ne viii W”, denotes the blue wing of the line. |
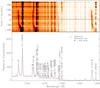 |
Fig. 6 Top panel: SUMER detector image taken at 15:48 UT. The region between the horizontal solid lines was used to produce the spectrum during the event. The same region was taken from the spectrum obtained later at 15:56 UT (shown in Fig. 7) to produce the reference spectrum. Bottom panel: the spectrum during the event is shown with a solid line, while the reference spectrum is shown with a dotted (red in the online version of the paper) line. “W” next to the line, e.g. “N v W”, denotes the blue wing of the line. |
The SUMER spectra were analysed by comparing them temporally and spatially with the imaging information from TRACE, CDS-intensity and Doppler-shift rasters, and the spectral data from CDS. The first SUMER exposure started at 15:31 UT (ended at 15:39 UT), which means that the fast wave has moved under the SUMER slit while exposing as can be seen in Fig. 2, panels 4−7. The analysis of the first spectrum shows no detection of the wave in the temperature range from 4.9 to 5.8 K (log Tmax). One of the most plausible explanations is that the wave, as known from imager data, is only detectable at temperatures higher than 1 MK, which is not recorded in the observed spectral range. The fact that the wave is not recorded in the Mg x and Ne viii (the contribution function of Ne viii has a strong tail toward higher temperatures) can also be due to the low emissivity of the wave front combined with the very long SUMER exposure time. The dimming/CME does not make it under the SUMER slit because it starts disintegrating shortly after the beginning of the SUMER exposure. In Fig. 5, we show the spectrum taken at 15:39 UT (the second spectrum in the Ne viii waveband). In Figs. 6 and 7, the spectra obtained in the N v wavelength range are presented.
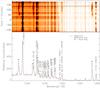 |
Fig. 7 Top panel: SUMER detector image taken at 15:56 UT. The region between the horizontal solid lines was used to produce the spectrum during the event shown with solid line in the bottom panel. The same region was taken from the spectrum obtained earlier at 15:48 UT (shown in Fig. 6) to produce the reference spectrum shown with a dotted line in the bottom panel. Bottom panel: the spectrum during the event is shown with a solid line, while the reference spectrum is given with a dotted (red in the online version of the paper) line. “W” next to the line, e.g. “N v W”, denotes the blue wing of the line. |
Next on the SUMER path is the eruptive filament. It is clearly noticeable in the bottom part of the first spectrum (Fig. 5) as blue-shifted emission in N iv, Ne viii, O iv, S v, and in some of the O v lines, i.e. spectral lines with transition-region formation temperatures in the range 5.0−5.8 K (log Tmax). The filament seen in the CDS FOV (Fig. 4) moves laterally while rising in a non-radial direction in the solar atmosphere. Note that the CDS Doppler-velocity images in the O v 629.73 Å line shown in Fig. 4 are obtained by fitting a single Gaussian. This method provides relatively good Doppler-shift imaging information about the dominant shift at each spatial pixel. For each raster, the wavelength of the rest component was obtained from the upper left part of the raster image not affected by the eruptive filament. The CDS intensity and Doppler-shift images reveal a twisted flux rope with a leading edge rising at speed above 300 kms-1 (the rasters at 15:42 UT, 15:47 UT, and 15:53 UT). The filament lower body displays at least a 3π twist and its speed is no more than 150 kms-1. These Doppler velocities clearly show an asymmetric filament eruption. The raster at 15:58 UT shows that the filament made a significant lateral displacement, but more importantly its speed decreased and part of its body show velocities close to zero, meaning that the filament reached its maximum height, decelerated and some of its material started falling back. This is consistent with the imaging information from EIT which, as we mentioned above, shows the filament stopping at a certain height. It should be noted that the CDS Doppler-shifts have errors of at least ±5 kms-1 in addition to the fact that they are only relative, which adds another minimum error of ±5 kms-1 to the values quoted here.
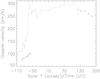 |
Fig. 8 Doppler velocity curves of the eruptive filament obtained from a double Gaussian fit in Ne viii 770.42 Å (solid line) during the exposure from 15:39 UT to 15:47 UT, in N v 1238.82 Å (dotted line) from 15:48 UT to 15:56 UT and from 15:56 UT to 16:03 UT (dashed line). |
The SUMER spectrum (Fig. 6) with an exposure starting at 15:48 UT shows the further apparent evolution of the feature with a sudden Doppler-shift increase, which remains relatively constant during the second (and last) exposure in the N v wavelength range. Because of the lateral filament displacement and the fact that the leading edge of the filament is not yet fully up, i.e. the filament is still slightly looped during the SUMER spectra starting at 15:39 UT and 15:48 UT, the Doppler shifts are relatively low (up to max 100 kms-1). The filament is recorded only in spectral lines emitting at transition region temperatures. No coronal emission was registered in the Mg x 624.9 Å (observed in second order) and Fe xii 1241.95 Å lines. Once the leading fast moving edge of the filament enters the SUMER slit FOV, the measured Doppler shift seen along the SUMER slit rises sharply. This is illustrated in Fig. 8. Without the imaging information from CDS and TRACE, the observed significant Doppler shift increase would have been interpreted as acceleration of the filament. Instead, it is clear that this rising speed of the filament is due to a faster-moving feature entering the spectrometer slit FOV. The Doppler velocities were obtained from two, and for some positions along the slit, even up to four Gaussians, in the Ne viii 770.42 Å and N v 1238.82 Å lines. Note that the Doppler-shift curves shown in Fig. 8 combine both time and space information (time: the duration of the exposure, space: the propagation of the feature along the SUMER slit). The Doppler velocities in the rest of the lines are on the same order as the Doppler velocities in Ne viii and N v.
4. Summary and conclusions
The study presented here started with the idea of providing spectroscopic insight into the coronal-wave phenomenon by analysing SUMER observations during one such event for the first time. During the course of the study, we extracted a wealth of information and provided for the first time a spectroscopic description of an asymmetric eruptive filament. We found that the coronal wave registered by EIT, TRACE, SUMER, and CDS was caused by a combined flare with two impulsive peaks. A CME was generated during the flare and a coronal wave was observed as the CME propagated across the solar disk in a non-radial, south-north direction. We clearly identified all the features that describe the bi-modal nature of the phenomenon EUV/EIT/coronal wave, i.e. a fast-mode wave and CME-driven compression. A “breaking” of the CME leading edge is followed by an asymmetric filament moving “through” the partly disintegrated dimming/CME and the CME-driven compression. We suggested that either CME-CME interaction or impulsive CME bubble over-expansion in the low solar atmosphere as a possible cause for the CME disintegration. The filament rises to a certain height and it appears to fall back to its source region. No signature of the wave was found in the spectroscopic SUMER and CDS data. An earlier detected hot-plasma emission in the Mg x 609.79 Å by HS was found to be caused by a blend from the O iv 609.83 Å line. The eruptive filament is recorded only in a transition-region temperature range 4.9−5.8 K (log Tmax) and no coronal emission was detected. Thanks to the time-space combined imaging and spectroscopic data, a sharp increase of the filament Doppler shift observed in the spectroscopic data was found be caused by the movement of the fast moving leading edge of the asymmetric filament under the SUMER slit rather than being produced by a filament acceleration. We found that the twisted body of the filament rises with a speed of up to 150 kms-1 while moving laterally. The leading edge of the filament lifts up almost twice as quick with speeds of around 300 kms-1.
Online material
Movie of Fig. A.1 Access Supplementary Material
5. Appendix A
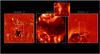 |
Fig. A.1 From left to right: EIT image running difference, TRACE original and TRACE running difference image. The square on the EIT image outlines the TRACE field-of-view while the inner rectangle is the CDS field-of-view. The TRACE running difference image is also over-plotted with CDS field-of-view. The upper small window shows a close view of the eruptive filament and is taken from the solid-line outlined region, over-plotted on the TRACE original image. An animation associated to this figure is available in the electronic edition. |
Acknowledgments
Research at Armagh Observatory is a grant aided by the N. Ireland Department of Culture, Arts and Leisure. M.M. is funded by the Leverhulme trust. We thank Richard Harrison for important discussion and an anonymous referee for insightful comments. M.M. thanks Kamalam Vanninathan, Astrid Veronig and Zhenghua Huang for fruitful discussions on this manuscript. We are grateful to Vasyl Yurchyshyn for providing us with the BBSO images. We thank STFC for the support via ST/J001082/1.
References
- Asai, A., Ishii, T. T., Isobe, H., et al. 2012, ApJ, 745, L18 [NASA ADS] [CrossRef] [Google Scholar]
- Attrill, G. D. R. 2010, ApJ, 718, 494 [NASA ADS] [CrossRef] [Google Scholar]
- Biesecker, D. A., Myers, D. C., Thompson, B. J., Hammer, D. M., & Vourlidas, A. 2002, ApJ, 569, 1009 [NASA ADS] [CrossRef] [Google Scholar]
- Brajša, R., Wöhl, H., Vršnak, B., et al. 2004, A&A, 414, 707 [NASA ADS] [CrossRef] [EDP Sciences] [Google Scholar]
- Brooks, D. H., & Warren, H. P. 2006, ApJS, 164, 202 [NASA ADS] [CrossRef] [Google Scholar]
- Chen, F., Ding, M. D., Chen, P. F., & Harra, L. K. 2011, ApJ, 740, 116 [NASA ADS] [CrossRef] [Google Scholar]
- Chen, P. F., Wu, S. T., Shibata, K., & Fang, C. 2002, ApJ, 572, L99 [NASA ADS] [CrossRef] [Google Scholar]
- Delaboudinière, J.-P., Artzner, G. E., Brunaud, J., et al. 1995, Sol. Phys., 162, 291 [NASA ADS] [CrossRef] [Google Scholar]
- Delannée, C., Török, T., Aulanier, G., & Hochedez, J.-F. 2008, Sol. Phys., 247, 123 [NASA ADS] [CrossRef] [Google Scholar]
- Delannée, C., Artzner, G., Schmieder, B., & Parenti, S. 2014, Sol. Phys., 289, 2565 [NASA ADS] [CrossRef] [Google Scholar]
- Downs, C., Roussev, I. I., van der Holst, B., et al. 2011, ApJ, 728, 2 [NASA ADS] [CrossRef] [Google Scholar]
- Downs, C., Roussev, I. I., van der Holst, B., Lugaz, N., & Sokolov, I. V. 2012, ApJ, 750, 134 [NASA ADS] [CrossRef] [Google Scholar]
- Forbes, T. G. 2000, J. Geophys. Res., 105, 23153 [NASA ADS] [CrossRef] [Google Scholar]
- Gallagher, P. T., & Long, D. M. 2011, Space Sci. Rev., 158, 365 [NASA ADS] [CrossRef] [Google Scholar]
- Harra, L. K., & Sterling, A. C. 2003, ApJ, 587, 429 [NASA ADS] [CrossRef] [Google Scholar]
- Harra, L. K., Sterling, A. C., Gömöry, P., & Veronig, A. 2011, ApJ, 737, L4 [NASA ADS] [CrossRef] [Google Scholar]
- Huang, Z., Madjarska, M. S., Koleva, K., et al. 2014, A&A, 566, A148 [NASA ADS] [CrossRef] [EDP Sciences] [Google Scholar]
- Joshi, N. C., Srivastava, A. K., Filippov, B., et al. 2013, ApJ, 771, 65 [NASA ADS] [CrossRef] [Google Scholar]
- Lemaire, P., Wilhelm, K., Curdt, W., et al. 1997, Sol. Phys., 170, 105 [NASA ADS] [CrossRef] [Google Scholar]
- Liu, W., & Ofman, L. 2014, Sol. Phys., 289, 3233 [NASA ADS] [CrossRef] [Google Scholar]
- Long, D. M., Gallagher, P. T., McAteer, R. T. J., & Bloomfield, D. S. 2008, ApJ, 680, L81 [Google Scholar]
- Long, D. M., Williams, D. R., Régnier, S., & Harra, L. K. 2013, Sol. Phys., 288, 567 [NASA ADS] [CrossRef] [Google Scholar]
- Madjarska, M. S., Dermendjiev, V. N., Mouradian, Z., & Nenovski, P. 1996, Astrophys. Lett. Comm., 34, 113 [Google Scholar]
- Moreton, G. E. 1960, AJ, 65, 494 [Google Scholar]
- Patsourakos, S., & Vourlidas, A. 2012, Sol. Phys., 281, 187 [NASA ADS] [Google Scholar]
- Patsourakos, S., Vourlidas, A., & Kliem, B. 2010a, A&A, 522, A100 [NASA ADS] [CrossRef] [EDP Sciences] [Google Scholar]
- Patsourakos, S., Vourlidas, A., & Stenborg, G. 2010b, ApJ, 724, L188 [Google Scholar]
- Schmidt, J. M., & Ofman, L. 2010, ApJ, 713, 1008 [NASA ADS] [CrossRef] [Google Scholar]
- Shen, Y., & Liu, Y. 2012, ApJ, 754, 7 [Google Scholar]
- Temmer, M., Veronig, A. M., Peinhart, V., & Vršnak, B. 2014, ApJ, 785, 85 [Google Scholar]
- Thompson, B. J., Plunkett, S. P., Gurman, J. B., et al. 1998, Geophys. Res. Lett., 25, 2465 [Google Scholar]
- Thompson, B. J., Gurman, J. B., Neupert, W. M., et al. 1999, ApJ, 517, L151 [NASA ADS] [CrossRef] [Google Scholar]
- Tian, H., Tu, C.-Y., He, J.-S., & Marsch, E. 2007, Adv. Space Res., 39, 1853 [NASA ADS] [CrossRef] [Google Scholar]
- Veronig, A. M., Temmer, M., Vršnak, B., & Thalmann, J. K. 2006, ApJ, 647, 1466 [NASA ADS] [CrossRef] [EDP Sciences] [Google Scholar]
- Veronig, A. M., Temmer, M., & Vršnak, B. 2008, ApJ, 681, L113 [Google Scholar]
- Veronig, A. M., Muhr, N., Kienreich, I. W., Temmer, M., & Vršnak, B. 2010, ApJ, 716, L57 [Google Scholar]
- Veronig, A. M., Gömöry, P., Kienreich, I. W., et al. 2011, ApJ, 743, L10 [Google Scholar]
- Vršnak, B., & Cliver, E. W. 2008, Sol. Phys., 253, 215 [NASA ADS] [CrossRef] [Google Scholar]
- Warmuth, A., Vršnak, B., Aurass, H., & Hanslmeier, A. 2001, ApJ, 560, L105 [Google Scholar]
- Warmuth, A., Vršnak, B., Magdalenić, J., Hanslmeier, A., & Otruba, W. 2004, A&A, 418, 1101 [NASA ADS] [CrossRef] [EDP Sciences] [Google Scholar]
- Wilhelm, K., Curdt, W., Marsch, E., et al. 1995, Sol. Phys., 162, 189 [NASA ADS] [CrossRef] [Google Scholar]
- Wilhelm, K., Lemaire, P., Curdt, W., et al. 1997, Sol. Phys., 170, 75 [NASA ADS] [CrossRef] [Google Scholar]
- Wills-Davey, M. J., & Thompson, B. J. 1999, Sol. Phys., 190, 467 [NASA ADS] [CrossRef] [Google Scholar]
- Wills-Davey, M. J., DeForest, C. E., & Stenflo, J. O. 2007, ApJ, 664, 556 [Google Scholar]
- Yang, L., Zhang, J., Liu, W., Li, T., & Shen, Y. 2013, ApJ, 775, 39 [NASA ADS] [CrossRef] [Google Scholar]
- Zhukov, A. N., & Auchère, F. 2004, A&A, 427, 705 [NASA ADS] [CrossRef] [EDP Sciences] [Google Scholar]
All Tables
All Figures
|
Fig. 1 GOES 9 1-min-averaged X-ray flux in the range 1−8 Å. |
| In the text | |
|
Fig. 2 TRACE running difference images. The solid line rectangle represents the CDS FOV. The dashed vertical line is the SUMER slit position. The over-plotted semicircles outline the border between the CME-driven compression and the dimming/CME. |
| In the text | |
|
Fig. 3 Hα BBSO synoptic images with a field-of-view covering NOAA 08237. Left: a filament is visible lying along the magnetic neutral line. Right: the upper part of the filament has disappeared leaving a small undisturbed part. The image is de-rotated to the time of the image taken on June 12. |
| In the text | |
|
Fig. 4 CDS O v 629.74 Å radiance and Doppler-shift images showing the eruptive filament. |
| In the text | |
|
Fig. 5 Top panel: SUMER detector image taken at 15:39 UT. The region between the horizontal solid lines was used to produce the spectrum during the event. The same region was taken from the spectrum obtained earlier at 15:31 UT (before the event) to produce the reference spectrum. Bottom panel: the spectrum during the event is shown with a solid line, while the reference spectrum is shown with a dotted (red in the online version of the paper) line. “W” next to the line, e.g. “Ne viii W”, denotes the blue wing of the line. |
| In the text | |
|
Fig. 6 Top panel: SUMER detector image taken at 15:48 UT. The region between the horizontal solid lines was used to produce the spectrum during the event. The same region was taken from the spectrum obtained later at 15:56 UT (shown in Fig. 7) to produce the reference spectrum. Bottom panel: the spectrum during the event is shown with a solid line, while the reference spectrum is shown with a dotted (red in the online version of the paper) line. “W” next to the line, e.g. “N v W”, denotes the blue wing of the line. |
| In the text | |
|
Fig. 7 Top panel: SUMER detector image taken at 15:56 UT. The region between the horizontal solid lines was used to produce the spectrum during the event shown with solid line in the bottom panel. The same region was taken from the spectrum obtained earlier at 15:48 UT (shown in Fig. 6) to produce the reference spectrum shown with a dotted line in the bottom panel. Bottom panel: the spectrum during the event is shown with a solid line, while the reference spectrum is given with a dotted (red in the online version of the paper) line. “W” next to the line, e.g. “N v W”, denotes the blue wing of the line. |
| In the text | |
|
Fig. 8 Doppler velocity curves of the eruptive filament obtained from a double Gaussian fit in Ne viii 770.42 Å (solid line) during the exposure from 15:39 UT to 15:47 UT, in N v 1238.82 Å (dotted line) from 15:48 UT to 15:56 UT and from 15:56 UT to 16:03 UT (dashed line). |
| In the text | |
|
Fig. A.1 From left to right: EIT image running difference, TRACE original and TRACE running difference image. The square on the EIT image outlines the TRACE field-of-view while the inner rectangle is the CDS field-of-view. The TRACE running difference image is also over-plotted with CDS field-of-view. The upper small window shows a close view of the eruptive filament and is taken from the solid-line outlined region, over-plotted on the TRACE original image. An animation associated to this figure is available in the electronic edition. |
| In the text | |
Current usage metrics show cumulative count of Article Views (full-text article views including HTML views, PDF and ePub downloads, according to the available data) and Abstracts Views on Vision4Press platform.
Data correspond to usage on the plateform after 2015. The current usage metrics is available 48-96 hours after online publication and is updated daily on week days.
Initial download of the metrics may take a while.