Fig. 6
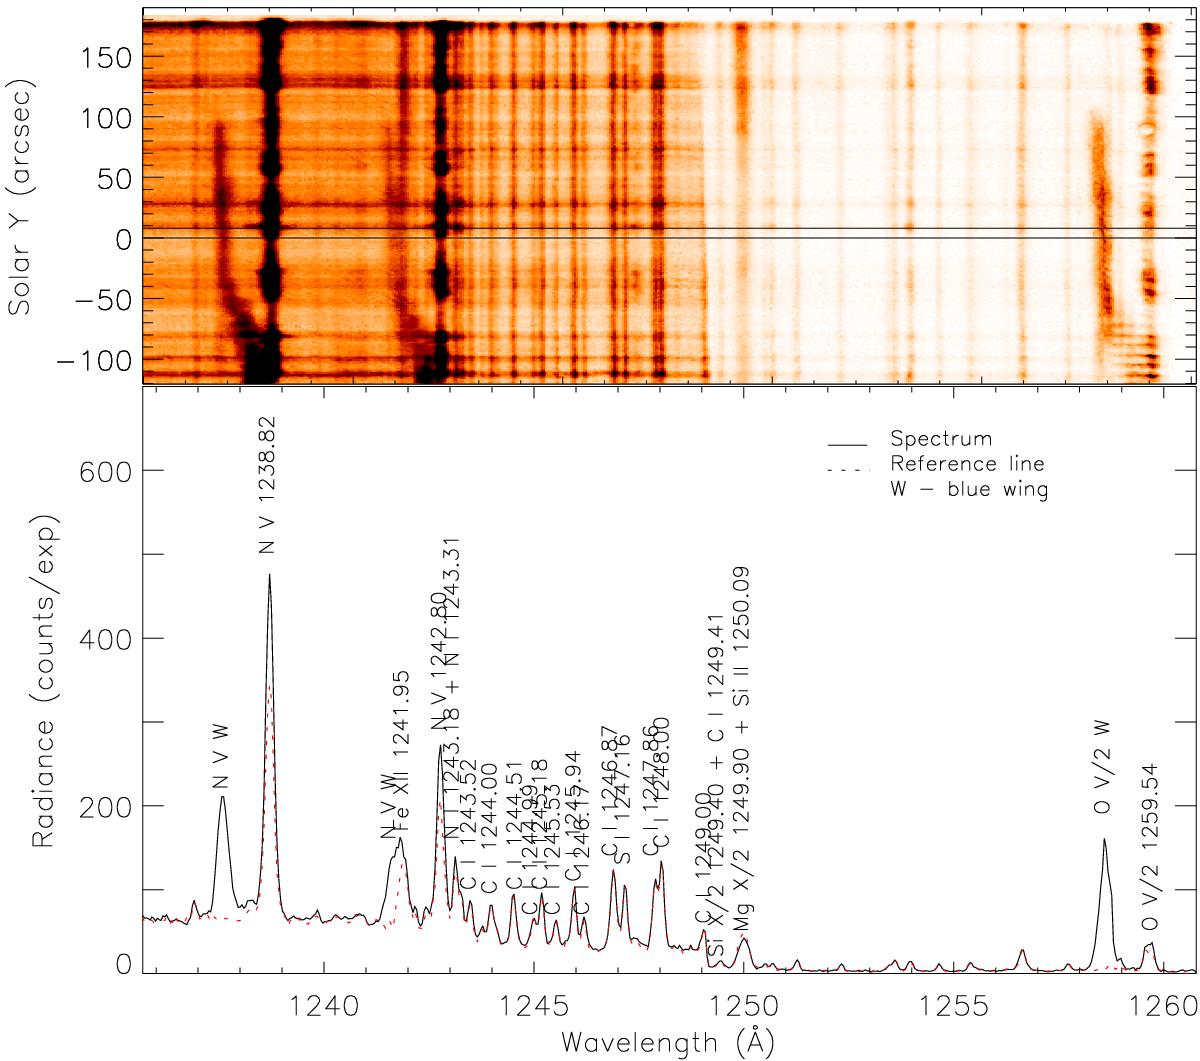
Top panel: SUMER detector image taken at 15:48 UT. The region between the horizontal solid lines was used to produce the spectrum during the event. The same region was taken from the spectrum obtained later at 15:56 UT (shown in Fig. 7) to produce the reference spectrum. Bottom panel: the spectrum during the event is shown with a solid line, while the reference spectrum is shown with a dotted (red in the online version of the paper) line. “W” next to the line, e.g. “N v W”, denotes the blue wing of the line.
Current usage metrics show cumulative count of Article Views (full-text article views including HTML views, PDF and ePub downloads, according to the available data) and Abstracts Views on Vision4Press platform.
Data correspond to usage on the plateform after 2015. The current usage metrics is available 48-96 hours after online publication and is updated daily on week days.
Initial download of the metrics may take a while.