Fig. A.1
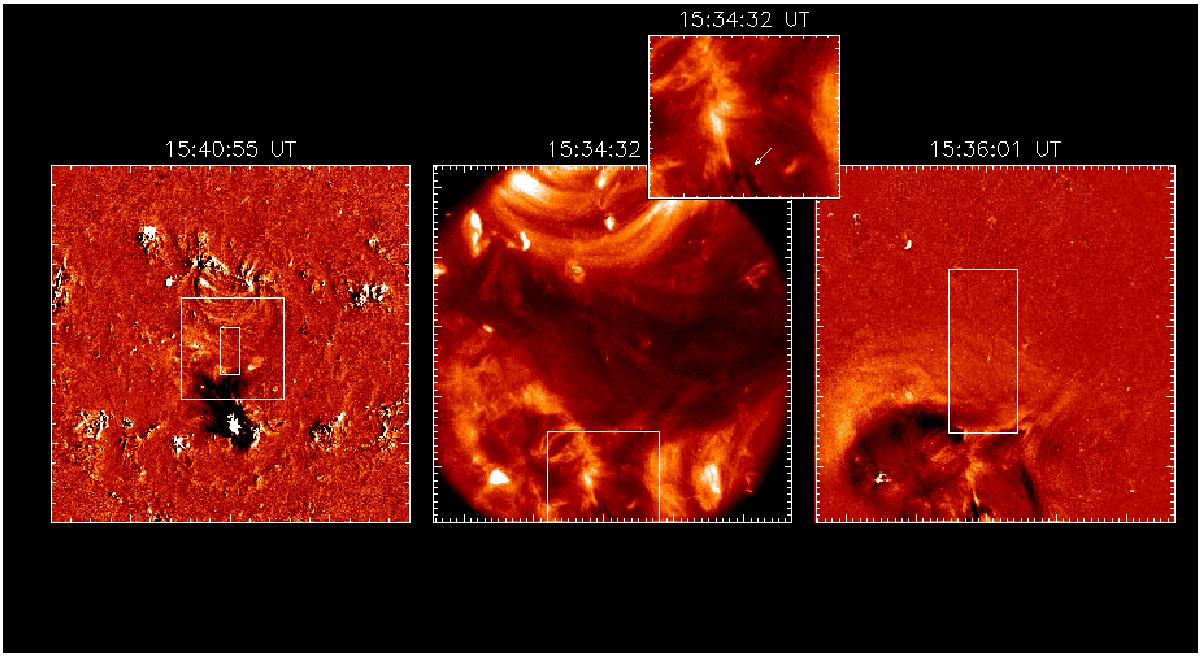
From left to right: EIT image running difference, TRACE original and TRACE running difference image. The square on the EIT image outlines the TRACE field-of-view while the inner rectangle is the CDS field-of-view. The TRACE running difference image is also over-plotted with CDS field-of-view. The upper small window shows a close view of the eruptive filament and is taken from the solid-line outlined region, over-plotted on the TRACE original image. An animation associated to this figure is available in the electronic edition.
Current usage metrics show cumulative count of Article Views (full-text article views including HTML views, PDF and ePub downloads, according to the available data) and Abstracts Views on Vision4Press platform.
Data correspond to usage on the plateform after 2015. The current usage metrics is available 48-96 hours after online publication and is updated daily on week days.
Initial download of the metrics may take a while.