Fig. 9
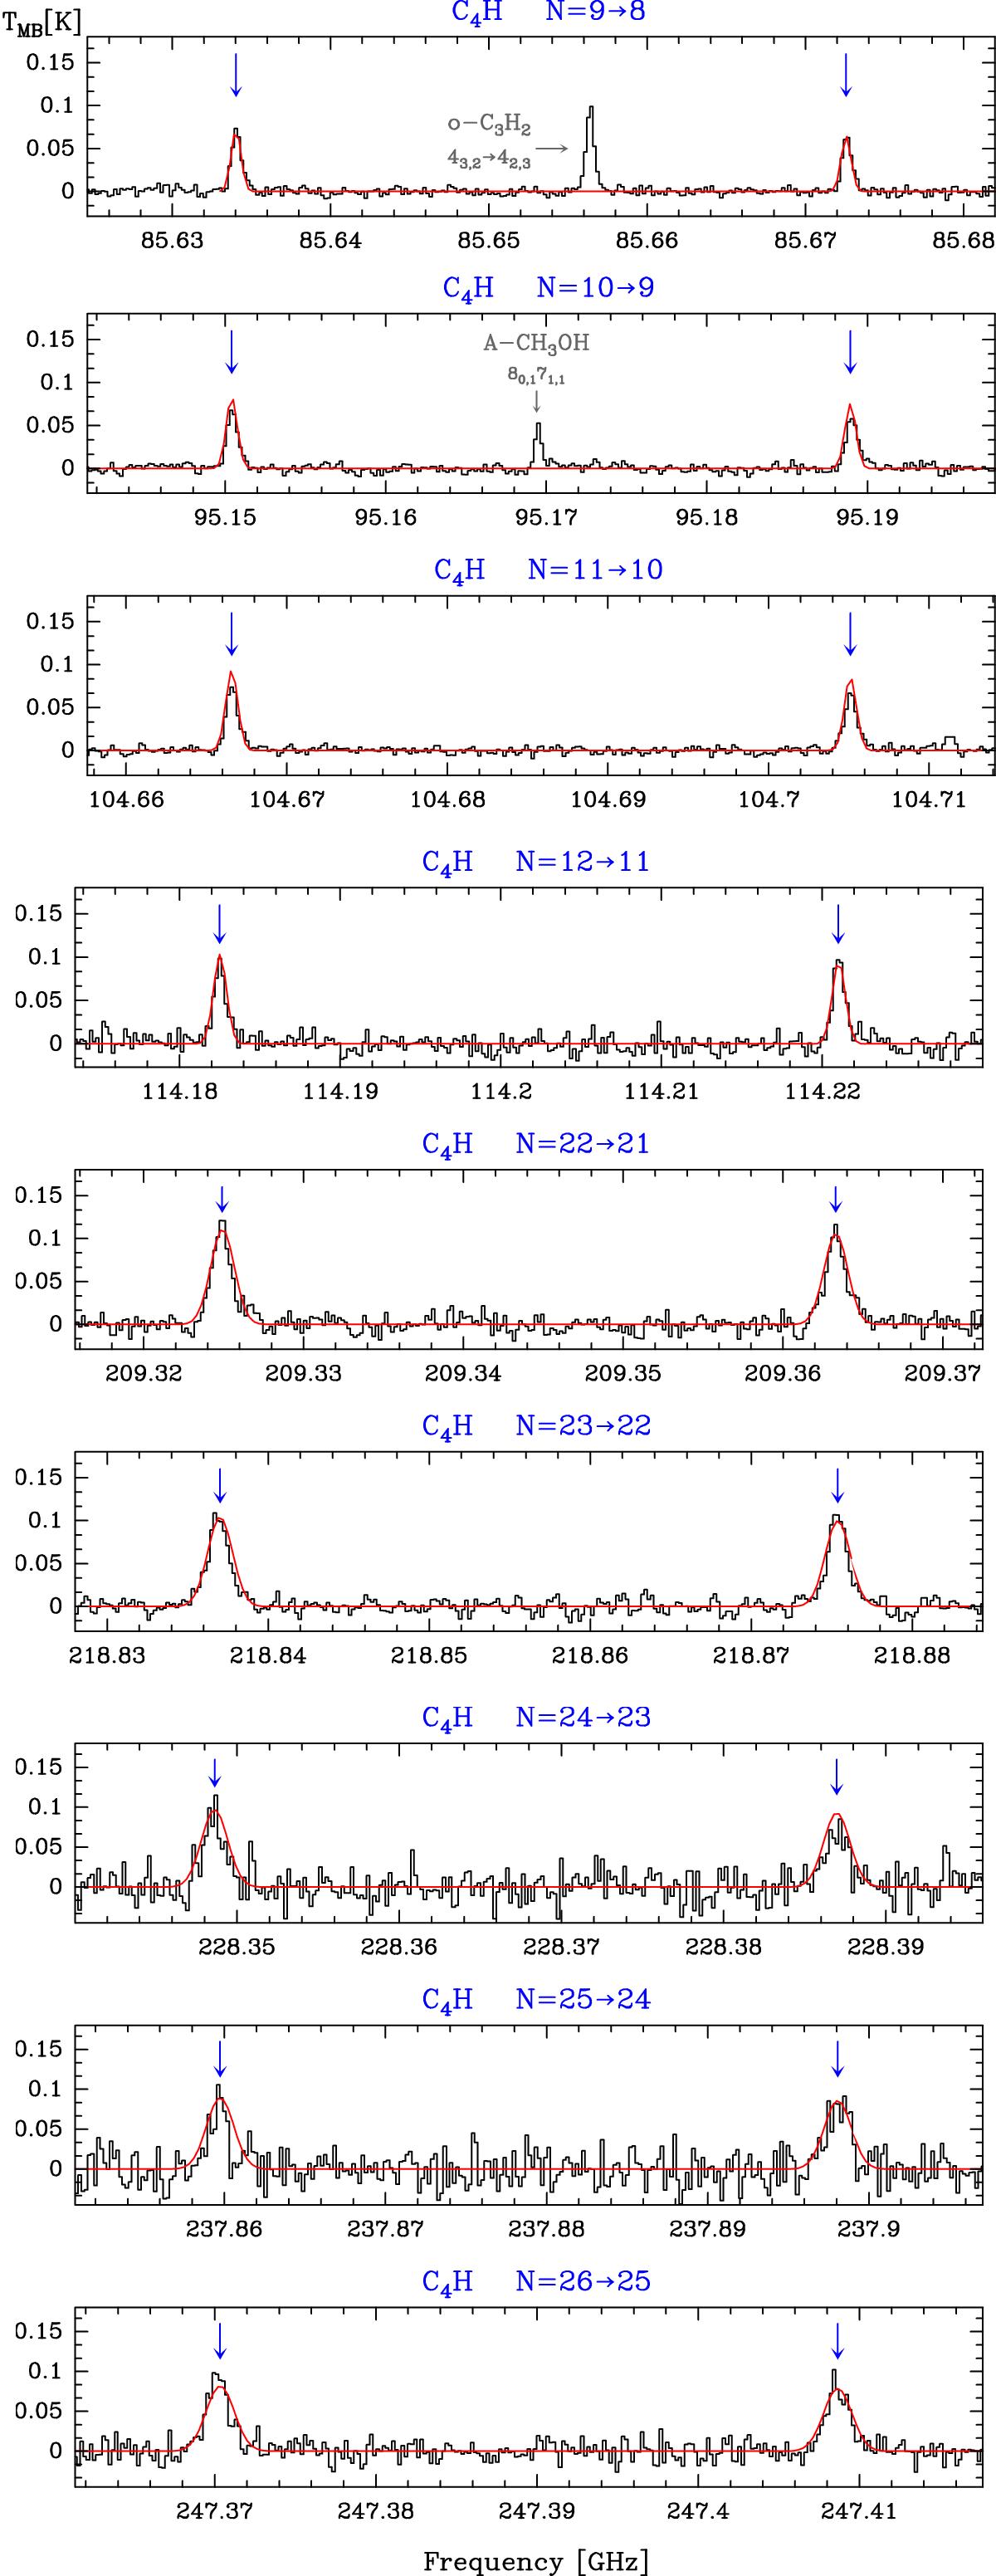
C4H spectra observed in the Orion Bar (black histogram spectra). A LTE model is overlaid in red (see Sect. 5.2). Line doublets are indicated by the blue arrows. The other spectral features appearing in the selected windows are labelled with their corresponding identification.
Current usage metrics show cumulative count of Article Views (full-text article views including HTML views, PDF and ePub downloads, according to the available data) and Abstracts Views on Vision4Press platform.
Data correspond to usage on the plateform after 2015. The current usage metrics is available 48-96 hours after online publication and is updated daily on week days.
Initial download of the metrics may take a while.