Fig. 4
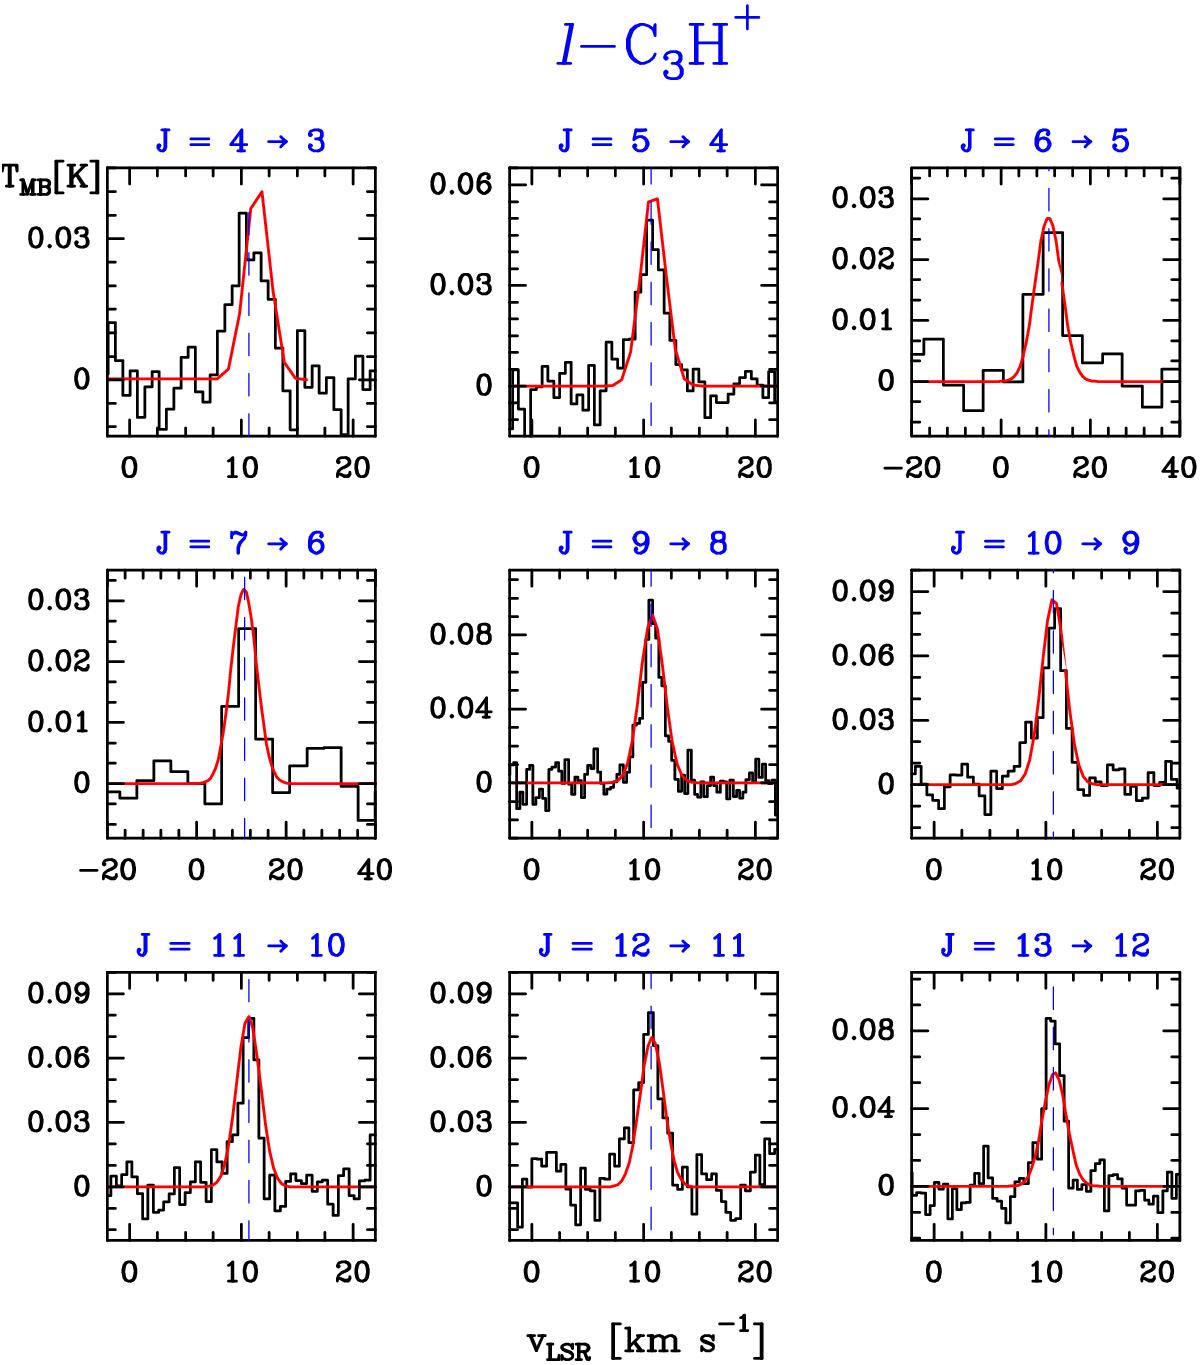
Series of l-C3H+ lines detected in the Orion Bar PDR. Spectra of the J = 4 → 3, 5 → 4, 9 → 8, 10 → 9, 11 → 10, 12 → 11, and 13 → 12 rotational transitions of l-C3H+ observed at 200 kHz spectral resolution, and 6 → 5 and 7 → 6 observed at 2 MHz (black histogram spectra). A LTE model is overlaid in red (see Sect. 5.2). The dashed lines indicate the LSR velocity (10.7 km s-1) of the Orion Bar PDR.
Current usage metrics show cumulative count of Article Views (full-text article views including HTML views, PDF and ePub downloads, according to the available data) and Abstracts Views on Vision4Press platform.
Data correspond to usage on the plateform after 2015. The current usage metrics is available 48-96 hours after online publication and is updated daily on week days.
Initial download of the metrics may take a while.