Fig. 20
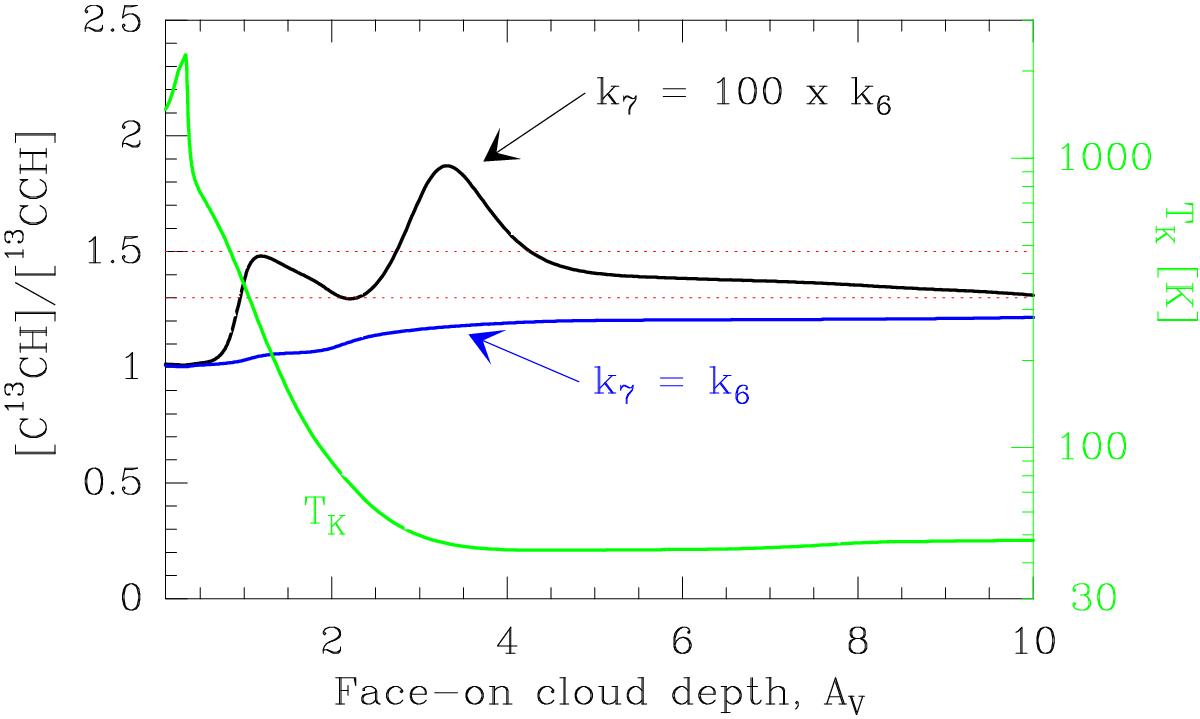
Reference isobaric photochemical model for the Orion Bar with P = 108
K cm-3 and
χ = 2 ×
104. 13C fractionation reactions have been included to
explain the observed [C13CH]/[13CCH] ratio (shown in the region enclosed by the
red dashed lines). The black curve show a model in which the rate of the
![]() reaction is 100 times higher than
that of the
reaction is 100 times higher than
that of the ![]() reaction (see text).
reaction (see text).
Current usage metrics show cumulative count of Article Views (full-text article views including HTML views, PDF and ePub downloads, according to the available data) and Abstracts Views on Vision4Press platform.
Data correspond to usage on the plateform after 2015. The current usage metrics is available 48-96 hours after online publication and is updated daily on week days.
Initial download of the metrics may take a while.