Fig. 18
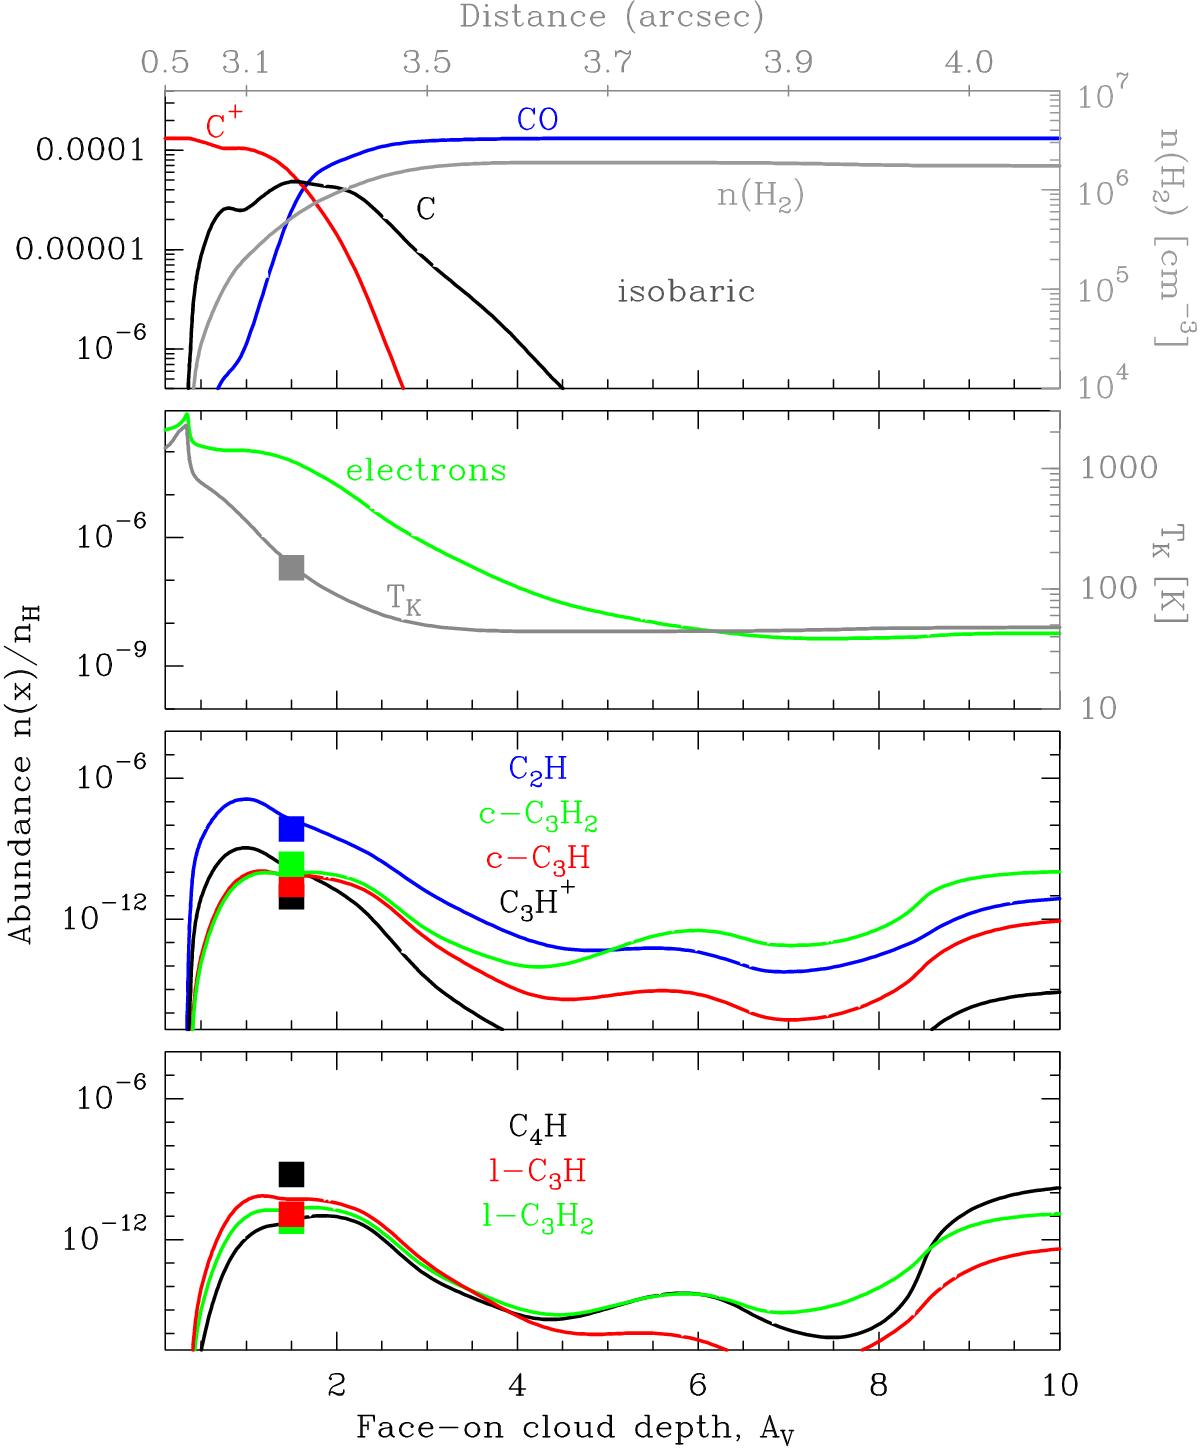
Reference isobaric photochemical model for the Orion Bar with P = 108 K cm-3 and χ = 2 × 10⁴. We note the increase of n(H2) as the gas temperatures decreases. The grey square shows the beam-averaged gas temperature estimated from our millimetre observations (Tk ≃ 150 K), which corresponds to AV ≃ 1.5 in the model. The coloured squares show the beam-averaged abundances derived from the line survey.
Current usage metrics show cumulative count of Article Views (full-text article views including HTML views, PDF and ePub downloads, according to the available data) and Abstracts Views on Vision4Press platform.
Data correspond to usage on the plateform after 2015. The current usage metrics is available 48-96 hours after online publication and is updated daily on week days.
Initial download of the metrics may take a while.